Russian vs Alsatian In Labor Force | Age 20-24
COMPARE
Russian
Alsatian
In Labor Force | Age 20-24
In Labor Force | Age 20-24 Comparison
Russians
Alsatians
74.8%
IN LABOR FORCE | AGE 20-24
32.2/ 100
METRIC RATING
190th/ 347
METRIC RANK
74.8%
IN LABOR FORCE | AGE 20-24
27.1/ 100
METRIC RATING
193rd/ 347
METRIC RANK
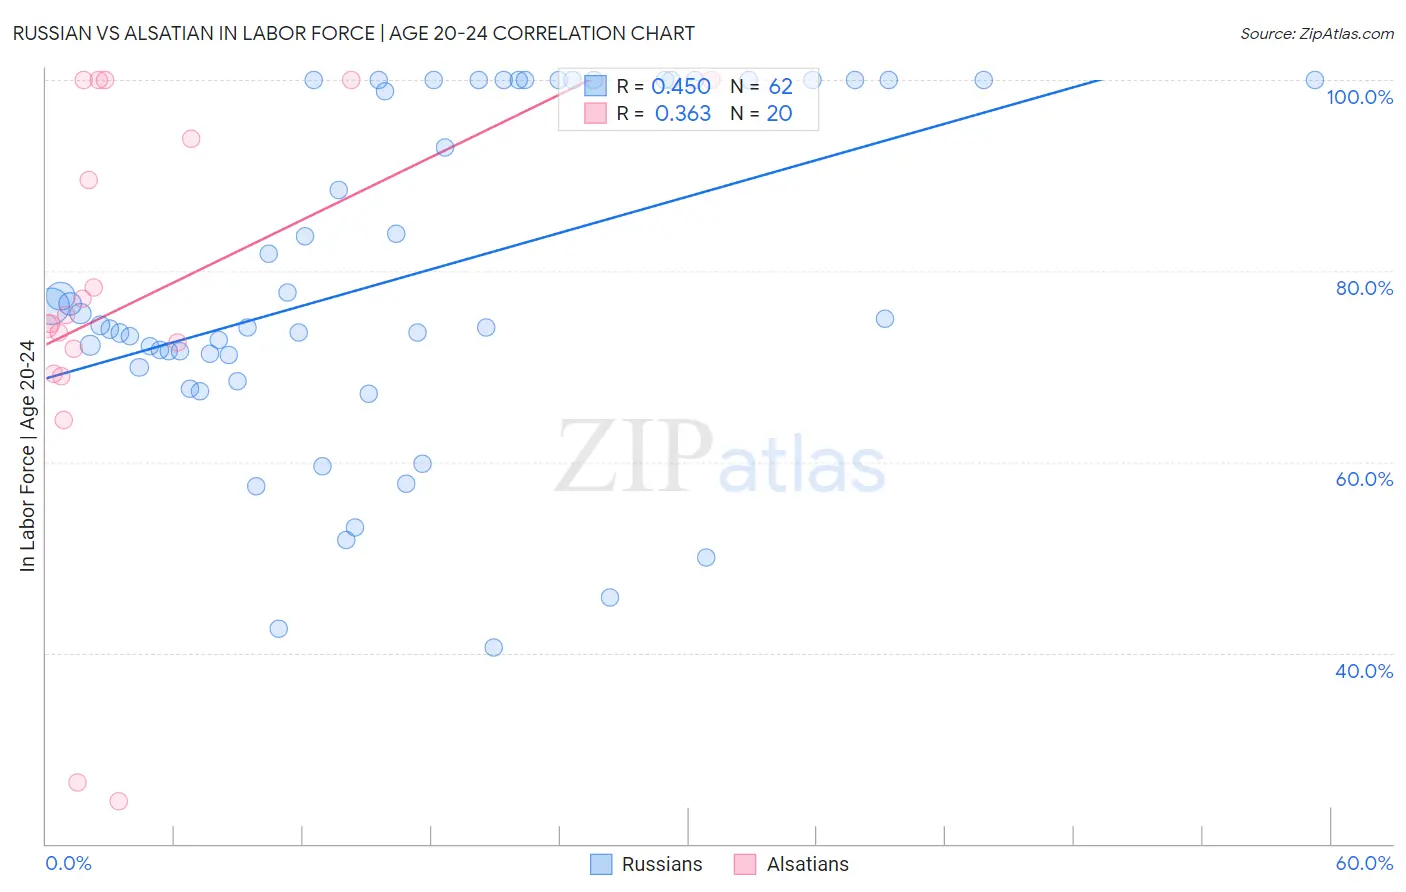
Russian vs Alsatian In Labor Force | Age 20-24 Correlation Chart
The statistical analysis conducted on geographies consisting of 511,601,024 people shows a moderate positive correlation between the proportion of Russians and labor force participation rate among population between the ages 20 and 24 in the United States with a correlation coefficient (R) of 0.450 and weighted average of 74.8%. Similarly, the statistical analysis conducted on geographies consisting of 82,637,215 people shows a mild positive correlation between the proportion of Alsatians and labor force participation rate among population between the ages 20 and 24 in the United States with a correlation coefficient (R) of 0.363 and weighted average of 74.8%, a difference of 0.090%.
In Labor Force | Age 20-24 Correlation Summary
| Measurement | Russian | Alsatian |
| Minimum | 40.6% | 24.4% |
| Maximum | 100.0% | 100.0% |
| Range | 59.4% | 75.6% |
| Mean | 79.2% | 76.7% |
| Median | 74.7% | 74.9% |
| Interquartile 25% (IQ1) | 71.1% | 70.5% |
| Interquartile 75% (IQ3) | 100.0% | 97.0% |
| Interquartile Range (IQR) | 28.9% | 26.5% |
| Standard Deviation (Sample) | 17.3% | 21.5% |
| Standard Deviation (Population) | 17.1% | 20.9% |
Demographics Similar to Russians and Alsatians by In Labor Force | Age 20-24
In terms of in labor force | age 20-24, the demographic groups most similar to Russians are Honduran (74.8%, a difference of 0.010%), Immigrants from Northern Europe (74.8%, a difference of 0.010%), Immigrants from Honduras (74.9%, a difference of 0.020%), Immigrants from Eastern Europe (74.9%, a difference of 0.030%), and Immigrants from Hungary (74.9%, a difference of 0.050%). Similarly, the demographic groups most similar to Alsatians are Immigrants from Europe (74.8%, a difference of 0.010%), Senegalese (74.8%, a difference of 0.020%), Immigrants from Denmark (74.8%, a difference of 0.030%), Eastern European (74.8%, a difference of 0.030%), and Immigrants from Vietnam (74.7%, a difference of 0.040%).
| Demographics | Rating | Rank | In Labor Force | Age 20-24 |
| Africans | 42.5 /100 | #181 | Average 75.0% |
| Immigrants | South Africa | 36.9 /100 | #182 | Fair 74.9% |
| Immigrants | Costa Rica | 36.7 /100 | #183 | Fair 74.9% |
| Immigrants | Hungary | 35.0 /100 | #184 | Fair 74.9% |
| Sri Lankans | 34.9 /100 | #185 | Fair 74.9% |
| Immigrants | Eastern Europe | 33.8 /100 | #186 | Fair 74.9% |
| Immigrants | Honduras | 33.5 /100 | #187 | Fair 74.9% |
| Hondurans | 32.7 /100 | #188 | Fair 74.8% |
| Immigrants | Northern Europe | 32.6 /100 | #189 | Fair 74.8% |
| Russians | 32.2 /100 | #190 | Fair 74.8% |
| Senegalese | 28.1 /100 | #191 | Fair 74.8% |
| Immigrants | Europe | 27.5 /100 | #192 | Fair 74.8% |
| Alsatians | 27.1 /100 | #193 | Fair 74.8% |
| Immigrants | Denmark | 25.8 /100 | #194 | Fair 74.8% |
| Eastern Europeans | 25.4 /100 | #195 | Fair 74.8% |
| Immigrants | Vietnam | 25.1 /100 | #196 | Fair 74.7% |
| Panamanians | 25.0 /100 | #197 | Fair 74.7% |
| Immigrants | Nigeria | 24.2 /100 | #198 | Fair 74.7% |
| Taiwanese | 23.2 /100 | #199 | Fair 74.7% |
| Nigerians | 21.9 /100 | #200 | Fair 74.7% |
| Choctaw | 21.4 /100 | #201 | Fair 74.7% |