Carpatho Rusyn vs Alsatian Median Male Earnings
COMPARE
Carpatho Rusyn
Alsatian
Median Male Earnings
Median Male Earnings Comparison
Carpatho Rusyns
Alsatians
$57,572
MEDIAN MALE EARNINGS
95.3/ 100
METRIC RATING
113th/ 347
METRIC RANK
$55,380
MEDIAN MALE EARNINGS
70.5/ 100
METRIC RATING
159th/ 347
METRIC RANK
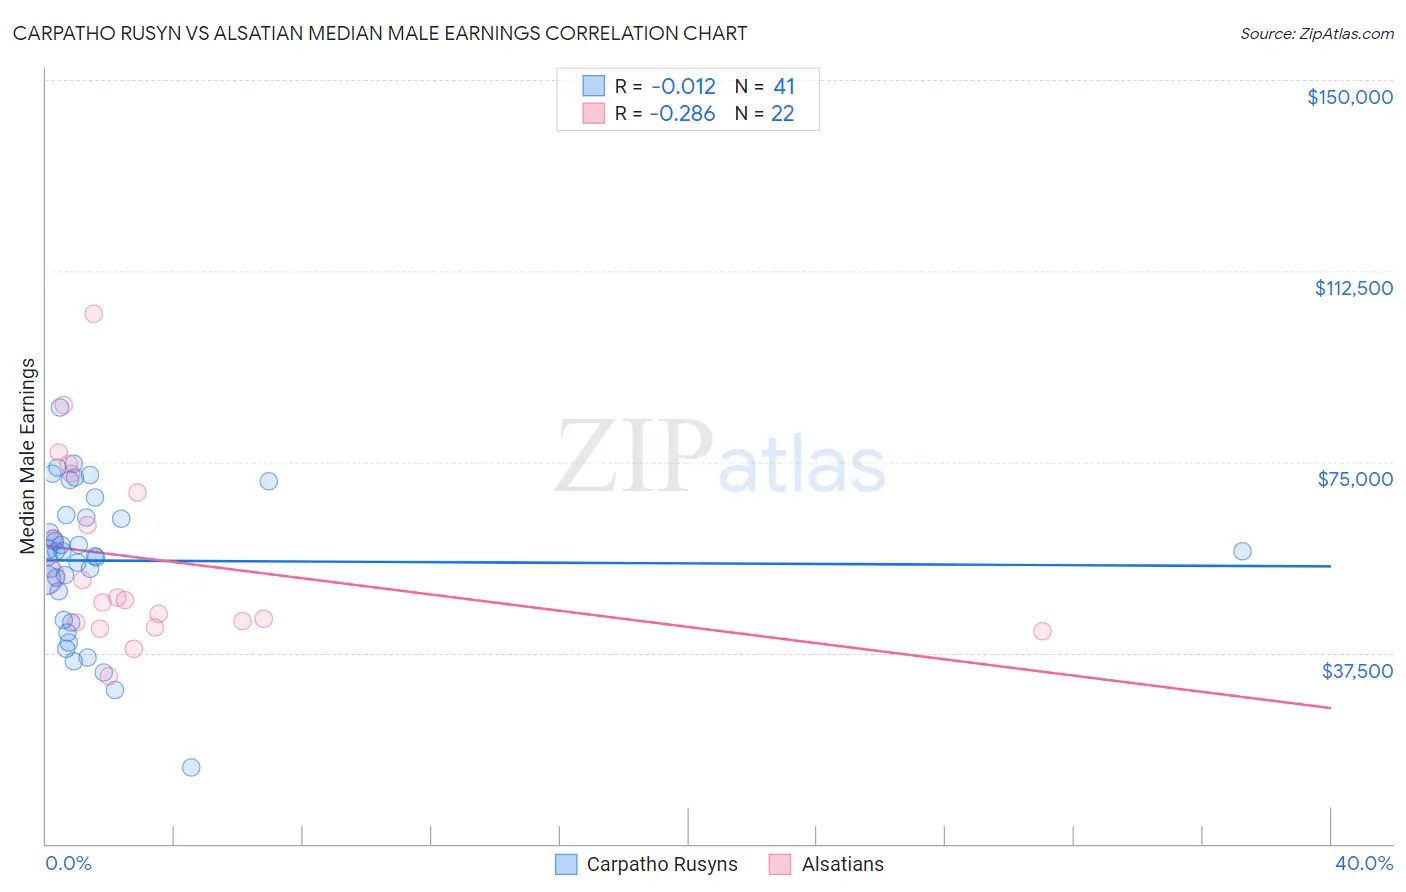
Carpatho Rusyn vs Alsatian Median Male Earnings Correlation Chart
The statistical analysis conducted on geographies consisting of 58,862,900 people shows no correlation between the proportion of Carpatho Rusyns and median male earnings in the United States with a correlation coefficient (R) of -0.012 and weighted average of $57,572. Similarly, the statistical analysis conducted on geographies consisting of 82,669,141 people shows a weak negative correlation between the proportion of Alsatians and median male earnings in the United States with a correlation coefficient (R) of -0.286 and weighted average of $55,380, a difference of 4.0%.
Median Male Earnings Correlation Summary
| Measurement | Carpatho Rusyn | Alsatian |
| Minimum | $15,000 | $33,005 |
| Maximum | $85,583 | $104,004 |
| Range | $70,583 | $70,999 |
| Mean | $55,604 | $55,815 |
| Median | $57,395 | $48,104 |
| Interquartile 25% (IQ1) | $46,688 | $43,478 |
| Interquartile 75% (IQ3) | $64,386 | $69,063 |
| Interquartile Range (IQR) | $17,699 | $25,585 |
| Standard Deviation (Sample) | $14,187 | $17,889 |
| Standard Deviation (Population) | $14,013 | $17,478 |
Similar Demographics by Median Male Earnings
Demographics Similar to Carpatho Rusyns by Median Male Earnings
In terms of median male earnings, the demographic groups most similar to Carpatho Rusyns are Immigrants from Afghanistan ($57,582, a difference of 0.020%), Immigrants from Kuwait ($57,562, a difference of 0.020%), European ($57,637, a difference of 0.11%), Swedish ($57,445, a difference of 0.22%), and Lebanese ($57,409, a difference of 0.28%).
| Demographics | Rating | Rank | Median Male Earnings |
| Immigrants | Northern Africa | 96.9 /100 | #106 | Exceptional $58,008 |
| Serbians | 96.8 /100 | #107 | Exceptional $57,975 |
| Immigrants | Uzbekistan | 96.7 /100 | #108 | Exceptional $57,941 |
| British | 96.5 /100 | #109 | Exceptional $57,890 |
| Palestinians | 96.2 /100 | #110 | Exceptional $57,778 |
| Europeans | 95.6 /100 | #111 | Exceptional $57,637 |
| Immigrants | Afghanistan | 95.4 /100 | #112 | Exceptional $57,582 |
| Carpatho Rusyns | 95.3 /100 | #113 | Exceptional $57,572 |
| Immigrants | Kuwait | 95.3 /100 | #114 | Exceptional $57,562 |
| Swedes | 94.8 /100 | #115 | Exceptional $57,445 |
| Lebanese | 94.6 /100 | #116 | Exceptional $57,409 |
| Immigrants | Zimbabwe | 94.3 /100 | #117 | Exceptional $57,352 |
| Hungarians | 94.0 /100 | #118 | Exceptional $57,309 |
| Arabs | 94.0 /100 | #119 | Exceptional $57,298 |
| Canadians | 93.9 /100 | #120 | Exceptional $57,286 |
Demographics Similar to Alsatians by Median Male Earnings
In terms of median male earnings, the demographic groups most similar to Alsatians are Czechoslovakian ($55,382, a difference of 0.0%), Basque ($55,370, a difference of 0.020%), Belgian ($55,361, a difference of 0.030%), French ($55,350, a difference of 0.050%), and Icelander ($55,415, a difference of 0.060%).
| Demographics | Rating | Rank | Median Male Earnings |
| Peruvians | 75.8 /100 | #152 | Good $55,659 |
| Immigrants | Nepal | 75.0 /100 | #153 | Good $55,615 |
| Taiwanese | 73.9 /100 | #154 | Good $55,556 |
| Scandinavians | 73.4 /100 | #155 | Good $55,527 |
| Immigrants | Ethiopia | 71.6 /100 | #156 | Good $55,434 |
| Icelanders | 71.2 /100 | #157 | Good $55,415 |
| Czechoslovakians | 70.5 /100 | #158 | Good $55,382 |
| Alsatians | 70.5 /100 | #159 | Good $55,380 |
| Basques | 70.3 /100 | #160 | Good $55,370 |
| Belgians | 70.1 /100 | #161 | Good $55,361 |
| French | 69.9 /100 | #162 | Good $55,350 |
| Ugandans | 68.6 /100 | #163 | Good $55,290 |
| Immigrants | South Eastern Asia | 67.6 /100 | #164 | Good $55,241 |
| Immigrants | Portugal | 66.3 /100 | #165 | Good $55,182 |
| Germans | 61.6 /100 | #166 | Good $54,974 |