Bolivian vs Alsatian Median Male Earnings
COMPARE
Bolivian
Alsatian
Median Male Earnings
Median Male Earnings Comparison
Bolivians
Alsatians
$61,066
MEDIAN MALE EARNINGS
99.8/ 100
METRIC RATING
61st/ 347
METRIC RANK
$55,380
MEDIAN MALE EARNINGS
70.5/ 100
METRIC RATING
159th/ 347
METRIC RANK
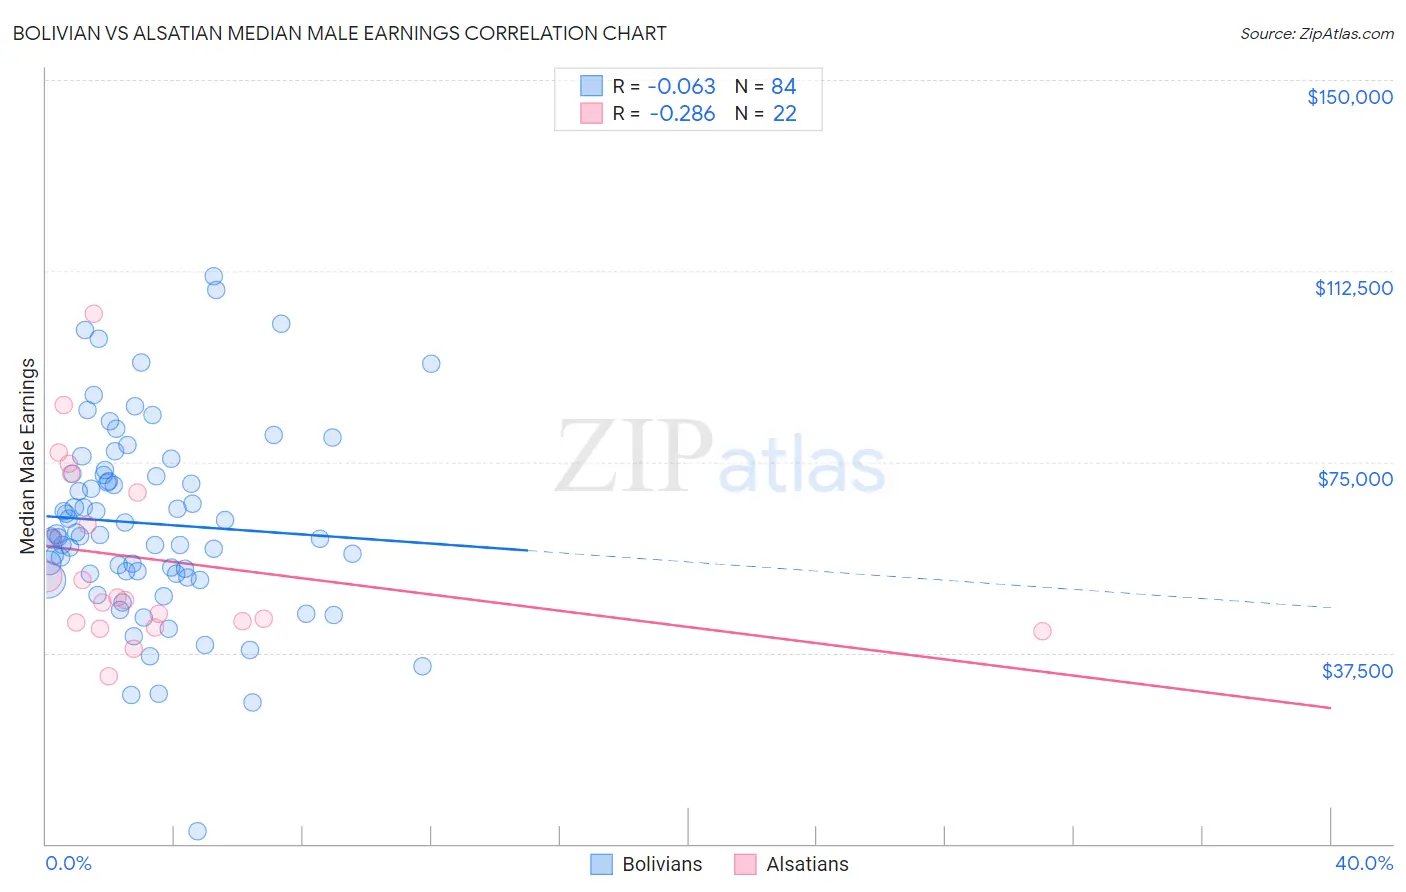
Bolivian vs Alsatian Median Male Earnings Correlation Chart
The statistical analysis conducted on geographies consisting of 184,669,287 people shows a slight negative correlation between the proportion of Bolivians and median male earnings in the United States with a correlation coefficient (R) of -0.063 and weighted average of $61,066. Similarly, the statistical analysis conducted on geographies consisting of 82,669,141 people shows a weak negative correlation between the proportion of Alsatians and median male earnings in the United States with a correlation coefficient (R) of -0.286 and weighted average of $55,380, a difference of 10.3%.
Median Male Earnings Correlation Summary
| Measurement | Bolivian | Alsatian |
| Minimum | $2,499 | $33,005 |
| Maximum | $111,480 | $104,004 |
| Range | $108,981 | $70,999 |
| Mean | $62,895 | $55,815 |
| Median | $60,590 | $48,104 |
| Interquartile 25% (IQ1) | $53,011 | $43,478 |
| Interquartile 75% (IQ3) | $72,615 | $69,063 |
| Interquartile Range (IQR) | $19,604 | $25,585 |
| Standard Deviation (Sample) | $18,921 | $17,889 |
| Standard Deviation (Population) | $18,808 | $17,478 |
Similar Demographics by Median Male Earnings
Demographics Similar to Bolivians by Median Male Earnings
In terms of median male earnings, the demographic groups most similar to Bolivians are Immigrants from Romania ($61,040, a difference of 0.040%), Immigrants from Netherlands ($61,096, a difference of 0.050%), Egyptian ($61,095, a difference of 0.050%), Immigrants from Pakistan ($60,987, a difference of 0.13%), and Immigrants from Eastern Europe ($60,958, a difference of 0.18%).
| Demographics | Rating | Rank | Median Male Earnings |
| Immigrants | Latvia | 99.9 /100 | #54 | Exceptional $61,422 |
| Greeks | 99.9 /100 | #55 | Exceptional $61,242 |
| Lithuanians | 99.9 /100 | #56 | Exceptional $61,228 |
| Immigrants | Scotland | 99.9 /100 | #57 | Exceptional $61,220 |
| New Zealanders | 99.9 /100 | #58 | Exceptional $61,199 |
| Immigrants | Netherlands | 99.8 /100 | #59 | Exceptional $61,096 |
| Egyptians | 99.8 /100 | #60 | Exceptional $61,095 |
| Bolivians | 99.8 /100 | #61 | Exceptional $61,066 |
| Immigrants | Romania | 99.8 /100 | #62 | Exceptional $61,040 |
| Immigrants | Pakistan | 99.8 /100 | #63 | Exceptional $60,987 |
| Immigrants | Eastern Europe | 99.8 /100 | #64 | Exceptional $60,958 |
| Immigrants | Indonesia | 99.8 /100 | #65 | Exceptional $60,935 |
| Immigrants | Croatia | 99.8 /100 | #66 | Exceptional $60,914 |
| Immigrants | Spain | 99.8 /100 | #67 | Exceptional $60,750 |
| Immigrants | Serbia | 99.7 /100 | #68 | Exceptional $60,600 |
Demographics Similar to Alsatians by Median Male Earnings
In terms of median male earnings, the demographic groups most similar to Alsatians are Czechoslovakian ($55,382, a difference of 0.0%), Basque ($55,370, a difference of 0.020%), Belgian ($55,361, a difference of 0.030%), French ($55,350, a difference of 0.050%), and Icelander ($55,415, a difference of 0.060%).
| Demographics | Rating | Rank | Median Male Earnings |
| Peruvians | 75.8 /100 | #152 | Good $55,659 |
| Immigrants | Nepal | 75.0 /100 | #153 | Good $55,615 |
| Taiwanese | 73.9 /100 | #154 | Good $55,556 |
| Scandinavians | 73.4 /100 | #155 | Good $55,527 |
| Immigrants | Ethiopia | 71.6 /100 | #156 | Good $55,434 |
| Icelanders | 71.2 /100 | #157 | Good $55,415 |
| Czechoslovakians | 70.5 /100 | #158 | Good $55,382 |
| Alsatians | 70.5 /100 | #159 | Good $55,380 |
| Basques | 70.3 /100 | #160 | Good $55,370 |
| Belgians | 70.1 /100 | #161 | Good $55,361 |
| French | 69.9 /100 | #162 | Good $55,350 |
| Ugandans | 68.6 /100 | #163 | Good $55,290 |
| Immigrants | South Eastern Asia | 67.6 /100 | #164 | Good $55,241 |
| Immigrants | Portugal | 66.3 /100 | #165 | Good $55,182 |
| Germans | 61.6 /100 | #166 | Good $54,974 |