Iraqi vs Alsatian Median Male Earnings
COMPARE
Iraqi
Alsatian
Median Male Earnings
Median Male Earnings Comparison
Iraqis
Alsatians
$54,182
MEDIAN MALE EARNINGS
42.5/ 100
METRIC RATING
180th/ 347
METRIC RANK
$55,380
MEDIAN MALE EARNINGS
70.5/ 100
METRIC RATING
159th/ 347
METRIC RANK
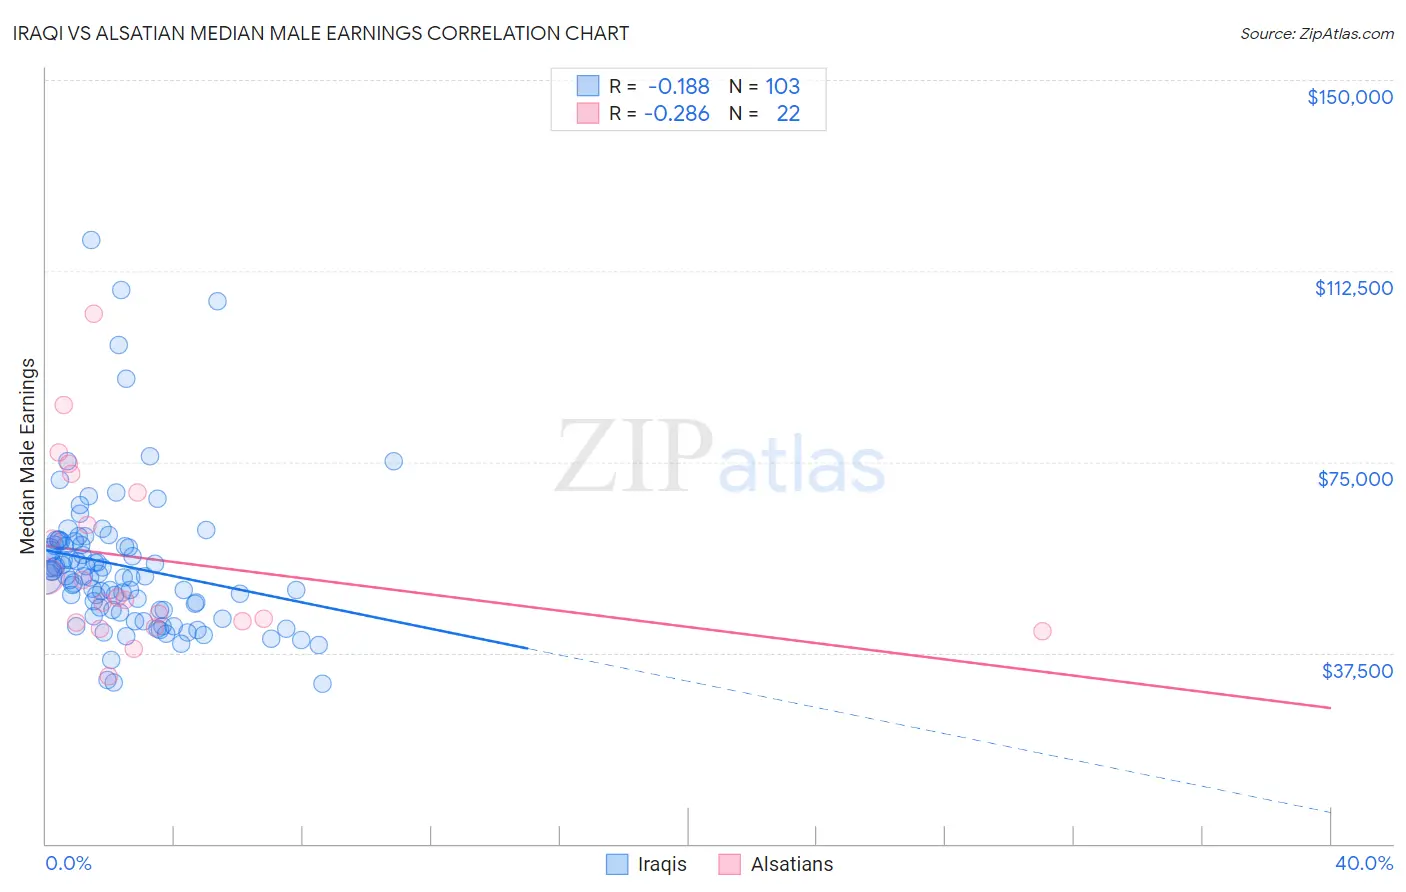
Iraqi vs Alsatian Median Male Earnings Correlation Chart
The statistical analysis conducted on geographies consisting of 170,629,617 people shows a poor negative correlation between the proportion of Iraqis and median male earnings in the United States with a correlation coefficient (R) of -0.188 and weighted average of $54,182. Similarly, the statistical analysis conducted on geographies consisting of 82,669,141 people shows a weak negative correlation between the proportion of Alsatians and median male earnings in the United States with a correlation coefficient (R) of -0.286 and weighted average of $55,380, a difference of 2.2%.
Median Male Earnings Correlation Summary
| Measurement | Iraqi | Alsatian |
| Minimum | $31,325 | $33,005 |
| Maximum | $118,495 | $104,004 |
| Range | $87,170 | $70,999 |
| Mean | $54,518 | $55,815 |
| Median | $52,559 | $48,104 |
| Interquartile 25% (IQ1) | $45,816 | $43,478 |
| Interquartile 75% (IQ3) | $58,664 | $69,063 |
| Interquartile Range (IQR) | $12,848 | $25,585 |
| Standard Deviation (Sample) | $14,678 | $17,889 |
| Standard Deviation (Population) | $14,607 | $17,478 |
Similar Demographics by Median Male Earnings
Demographics Similar to Iraqis by Median Male Earnings
In terms of median male earnings, the demographic groups most similar to Iraqis are Immigrants ($54,168, a difference of 0.030%), Celtic ($54,242, a difference of 0.11%), Costa Rican ($54,279, a difference of 0.18%), Sierra Leonean ($54,279, a difference of 0.18%), and Spaniard ($54,401, a difference of 0.40%).
| Demographics | Rating | Rank | Median Male Earnings |
| South American Indians | 50.4 /100 | #173 | Average $54,508 |
| South Americans | 50.0 /100 | #174 | Average $54,492 |
| Dutch | 48.0 /100 | #175 | Average $54,410 |
| Spaniards | 47.8 /100 | #176 | Average $54,401 |
| Costa Ricans | 44.8 /100 | #177 | Average $54,279 |
| Sierra Leoneans | 44.8 /100 | #178 | Average $54,279 |
| Celtics | 43.9 /100 | #179 | Average $54,242 |
| Iraqis | 42.5 /100 | #180 | Average $54,182 |
| Immigrants | Immigrants | 42.1 /100 | #181 | Average $54,168 |
| Yugoslavians | 37.4 /100 | #182 | Fair $53,967 |
| Immigrants | South America | 37.3 /100 | #183 | Fair $53,962 |
| Whites/Caucasians | 36.5 /100 | #184 | Fair $53,925 |
| Immigrants | Sierra Leone | 36.0 /100 | #185 | Fair $53,905 |
| Colombians | 34.4 /100 | #186 | Fair $53,832 |
| Immigrants | Eritrea | 31.8 /100 | #187 | Fair $53,715 |
Demographics Similar to Alsatians by Median Male Earnings
In terms of median male earnings, the demographic groups most similar to Alsatians are Czechoslovakian ($55,382, a difference of 0.0%), Basque ($55,370, a difference of 0.020%), Belgian ($55,361, a difference of 0.030%), French ($55,350, a difference of 0.050%), and Icelander ($55,415, a difference of 0.060%).
| Demographics | Rating | Rank | Median Male Earnings |
| Peruvians | 75.8 /100 | #152 | Good $55,659 |
| Immigrants | Nepal | 75.0 /100 | #153 | Good $55,615 |
| Taiwanese | 73.9 /100 | #154 | Good $55,556 |
| Scandinavians | 73.4 /100 | #155 | Good $55,527 |
| Immigrants | Ethiopia | 71.6 /100 | #156 | Good $55,434 |
| Icelanders | 71.2 /100 | #157 | Good $55,415 |
| Czechoslovakians | 70.5 /100 | #158 | Good $55,382 |
| Alsatians | 70.5 /100 | #159 | Good $55,380 |
| Basques | 70.3 /100 | #160 | Good $55,370 |
| Belgians | 70.1 /100 | #161 | Good $55,361 |
| French | 69.9 /100 | #162 | Good $55,350 |
| Ugandans | 68.6 /100 | #163 | Good $55,290 |
| Immigrants | South Eastern Asia | 67.6 /100 | #164 | Good $55,241 |
| Immigrants | Portugal | 66.3 /100 | #165 | Good $55,182 |
| Germans | 61.6 /100 | #166 | Good $54,974 |