Russian vs Zimbabwean Median Male Earnings
COMPARE
Russian
Zimbabwean
Median Male Earnings
Median Male Earnings Comparison
Russians
Zimbabweans
$63,939
MEDIAN MALE EARNINGS
100.0/ 100
METRIC RATING
28th/ 347
METRIC RANK
$56,302
MEDIAN MALE EARNINGS
85.5/ 100
METRIC RATING
139th/ 347
METRIC RANK
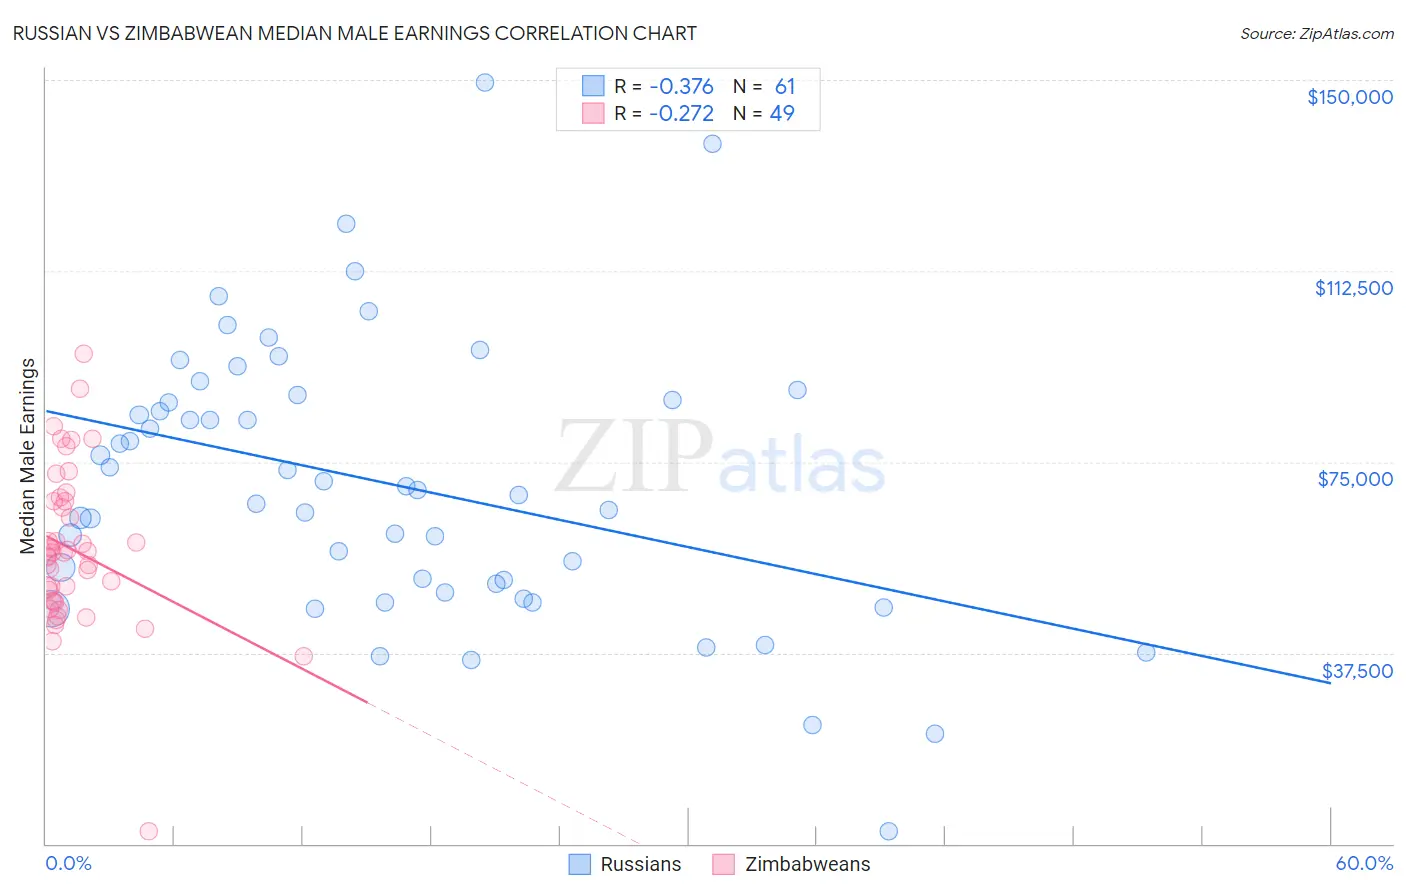
Russian vs Zimbabwean Median Male Earnings Correlation Chart
The statistical analysis conducted on geographies consisting of 511,765,575 people shows a mild negative correlation between the proportion of Russians and median male earnings in the United States with a correlation coefficient (R) of -0.376 and weighted average of $63,939. Similarly, the statistical analysis conducted on geographies consisting of 69,206,147 people shows a weak negative correlation between the proportion of Zimbabweans and median male earnings in the United States with a correlation coefficient (R) of -0.272 and weighted average of $56,302, a difference of 13.6%.
Median Male Earnings Correlation Summary
| Measurement | Russian | Zimbabwean |
| Minimum | $2,499 | $2,499 |
| Maximum | $149,573 | $96,250 |
| Range | $147,074 | $93,751 |
| Mean | $70,744 | $57,721 |
| Median | $69,557 | $57,093 |
| Interquartile 25% (IQ1) | $50,291 | $47,581 |
| Interquartile 75% (IQ3) | $87,600 | $67,190 |
| Interquartile Range (IQR) | $37,309 | $19,609 |
| Standard Deviation (Sample) | $27,498 | $15,546 |
| Standard Deviation (Population) | $27,272 | $15,387 |
Similar Demographics by Median Male Earnings
Demographics Similar to Russians by Median Male Earnings
In terms of median male earnings, the demographic groups most similar to Russians are Immigrants from Switzerland ($63,944, a difference of 0.010%), Asian ($63,827, a difference of 0.17%), Immigrants from France ($63,715, a difference of 0.35%), Turkish ($64,253, a difference of 0.49%), and Latvian ($63,498, a difference of 0.69%).
| Demographics | Rating | Rank | Median Male Earnings |
| Immigrants | Sweden | 100.0 /100 | #21 | Exceptional $65,406 |
| Burmese | 100.0 /100 | #22 | Exceptional $65,236 |
| Immigrants | Korea | 100.0 /100 | #23 | Exceptional $65,079 |
| Immigrants | Northern Europe | 100.0 /100 | #24 | Exceptional $64,987 |
| Immigrants | Denmark | 100.0 /100 | #25 | Exceptional $64,625 |
| Turks | 100.0 /100 | #26 | Exceptional $64,253 |
| Immigrants | Switzerland | 100.0 /100 | #27 | Exceptional $63,944 |
| Russians | 100.0 /100 | #28 | Exceptional $63,939 |
| Asians | 100.0 /100 | #29 | Exceptional $63,827 |
| Immigrants | France | 100.0 /100 | #30 | Exceptional $63,715 |
| Latvians | 100.0 /100 | #31 | Exceptional $63,498 |
| Soviet Union | 100.0 /100 | #32 | Exceptional $63,382 |
| Immigrants | Lithuania | 100.0 /100 | #33 | Exceptional $63,346 |
| Immigrants | Russia | 100.0 /100 | #34 | Exceptional $63,326 |
| Immigrants | Asia | 100.0 /100 | #35 | Exceptional $63,240 |
Demographics Similar to Zimbabweans by Median Male Earnings
In terms of median male earnings, the demographic groups most similar to Zimbabweans are Luxembourger ($56,300, a difference of 0.0%), Slovak ($56,306, a difference of 0.010%), Danish ($56,246, a difference of 0.10%), Ethiopian ($56,243, a difference of 0.10%), and Slavic ($56,390, a difference of 0.16%).
| Demographics | Rating | Rank | Median Male Earnings |
| Czechs | 88.2 /100 | #132 | Excellent $56,546 |
| Immigrants | Germany | 88.2 /100 | #133 | Excellent $56,542 |
| Moroccans | 87.7 /100 | #134 | Excellent $56,499 |
| Irish | 87.4 /100 | #135 | Excellent $56,464 |
| Immigrants | Saudi Arabia | 87.2 /100 | #136 | Excellent $56,452 |
| Slavs | 86.5 /100 | #137 | Excellent $56,390 |
| Slovaks | 85.5 /100 | #138 | Excellent $56,306 |
| Zimbabweans | 85.5 /100 | #139 | Excellent $56,302 |
| Luxembourgers | 85.5 /100 | #140 | Excellent $56,300 |
| Danes | 84.8 /100 | #141 | Excellent $56,246 |
| Ethiopians | 84.8 /100 | #142 | Excellent $56,243 |
| Sri Lankans | 83.4 /100 | #143 | Excellent $56,136 |
| Immigrants | Uganda | 82.4 /100 | #144 | Excellent $56,064 |
| Norwegians | 80.9 /100 | #145 | Excellent $55,965 |
| Immigrants | Chile | 80.7 /100 | #146 | Excellent $55,954 |