Immigrants from North America vs Alsatian Median Earnings
COMPARE
Immigrants from North America
Alsatian
Median Earnings
Median Earnings Comparison
Immigrants from North America
Alsatians
$50,108
MEDIAN EARNINGS
99.4/ 100
METRIC RATING
89th/ 347
METRIC RANK
$47,023
MEDIAN EARNINGS
69.6/ 100
METRIC RATING
160th/ 347
METRIC RANK
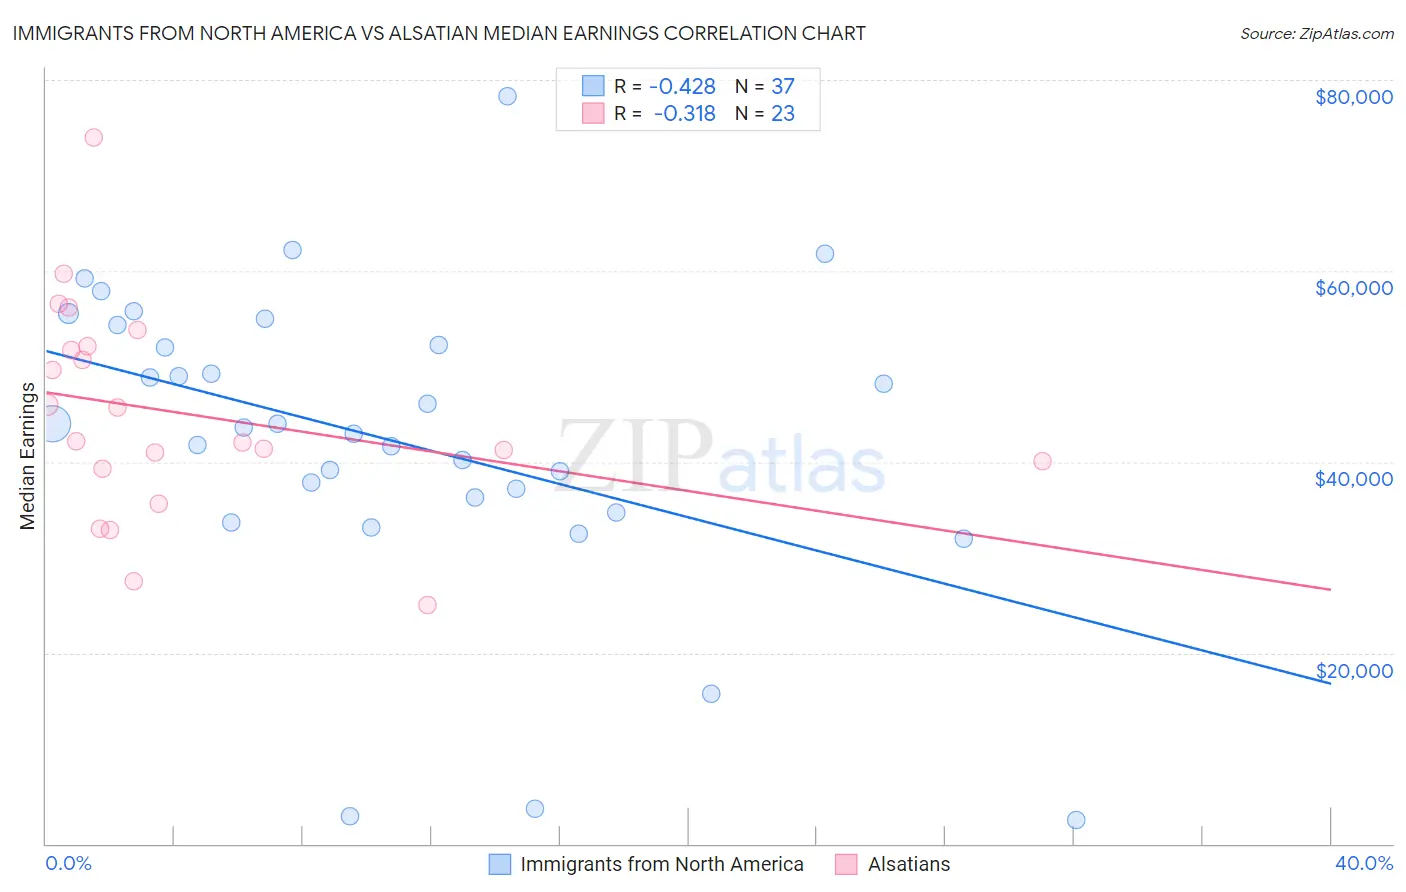
Immigrants from North America vs Alsatian Median Earnings Correlation Chart
The statistical analysis conducted on geographies consisting of 462,391,423 people shows a moderate negative correlation between the proportion of Immigrants from North America and median earnings in the United States with a correlation coefficient (R) of -0.428 and weighted average of $50,108. Similarly, the statistical analysis conducted on geographies consisting of 82,677,221 people shows a mild negative correlation between the proportion of Alsatians and median earnings in the United States with a correlation coefficient (R) of -0.318 and weighted average of $47,023, a difference of 6.6%.
Median Earnings Correlation Summary
| Measurement | Immigrants from North America | Alsatian |
| Minimum | $2,499 | $25,064 |
| Maximum | $78,310 | $73,935 |
| Range | $75,811 | $48,871 |
| Mean | $42,268 | $45,093 |
| Median | $43,536 | $42,188 |
| Interquartile 25% (IQ1) | $35,442 | $39,345 |
| Interquartile 75% (IQ3) | $53,269 | $52,137 |
| Interquartile Range (IQR) | $17,827 | $12,792 |
| Standard Deviation (Sample) | $16,254 | $11,160 |
| Standard Deviation (Population) | $16,033 | $10,915 |
Similar Demographics by Median Earnings
Demographics Similar to Immigrants from North America by Median Earnings
In terms of median earnings, the demographic groups most similar to Immigrants from North America are Albanian ($50,116, a difference of 0.020%), Immigrants from Uzbekistan ($50,151, a difference of 0.090%), Immigrants from Canada ($50,192, a difference of 0.17%), Immigrants from Kazakhstan ($50,225, a difference of 0.23%), and Immigrants from Hungary ($50,227, a difference of 0.24%).
| Demographics | Rating | Rank | Median Earnings |
| Immigrants | Moldova | 99.5 /100 | #82 | Exceptional $50,274 |
| Romanians | 99.5 /100 | #83 | Exceptional $50,244 |
| Immigrants | Hungary | 99.5 /100 | #84 | Exceptional $50,227 |
| Immigrants | Kazakhstan | 99.5 /100 | #85 | Exceptional $50,225 |
| Immigrants | Canada | 99.5 /100 | #86 | Exceptional $50,192 |
| Immigrants | Uzbekistan | 99.5 /100 | #87 | Exceptional $50,151 |
| Albanians | 99.4 /100 | #88 | Exceptional $50,116 |
| Immigrants | North America | 99.4 /100 | #89 | Exceptional $50,108 |
| Italians | 99.3 /100 | #90 | Exceptional $49,915 |
| Macedonians | 99.2 /100 | #91 | Exceptional $49,893 |
| Immigrants | Argentina | 99.2 /100 | #92 | Exceptional $49,841 |
| Armenians | 99.1 /100 | #93 | Exceptional $49,804 |
| Croatians | 99.0 /100 | #94 | Exceptional $49,724 |
| Immigrants | England | 99.0 /100 | #95 | Exceptional $49,722 |
| Immigrants | Lebanon | 99.0 /100 | #96 | Exceptional $49,682 |
Demographics Similar to Alsatians by Median Earnings
In terms of median earnings, the demographic groups most similar to Alsatians are Immigrants from Peru ($47,025, a difference of 0.0%), Immigrants from Eastern Africa ($46,969, a difference of 0.11%), Slovak ($47,095, a difference of 0.15%), South American Indian ($46,952, a difference of 0.15%), and Icelander ($46,916, a difference of 0.23%).
| Demographics | Rating | Rank | Median Earnings |
| Slavs | 81.1 /100 | #153 | Excellent $47,470 |
| Immigrants | Portugal | 77.3 /100 | #154 | Good $47,304 |
| Immigrants | Vietnam | 76.7 /100 | #155 | Good $47,282 |
| Irish | 76.6 /100 | #156 | Good $47,276 |
| Czechs | 75.1 /100 | #157 | Good $47,221 |
| Slovaks | 71.7 /100 | #158 | Good $47,095 |
| Immigrants | Peru | 69.6 /100 | #159 | Good $47,025 |
| Alsatians | 69.6 /100 | #160 | Good $47,023 |
| Immigrants | Eastern Africa | 68.0 /100 | #161 | Good $46,969 |
| South American Indians | 67.4 /100 | #162 | Good $46,952 |
| Icelanders | 66.3 /100 | #163 | Good $46,916 |
| Norwegians | 64.7 /100 | #164 | Good $46,865 |
| South Americans | 62.7 /100 | #165 | Good $46,804 |
| Czechoslovakians | 57.8 /100 | #166 | Average $46,658 |
| Costa Ricans | 57.4 /100 | #167 | Average $46,645 |