Immigrants from Barbados vs Alsatian Median Earnings
COMPARE
Immigrants from Barbados
Alsatian
Median Earnings
Median Earnings Comparison
Immigrants from Barbados
Alsatians
$45,816
MEDIAN EARNINGS
29.6/ 100
METRIC RATING
199th/ 347
METRIC RANK
$47,023
MEDIAN EARNINGS
69.6/ 100
METRIC RATING
160th/ 347
METRIC RANK
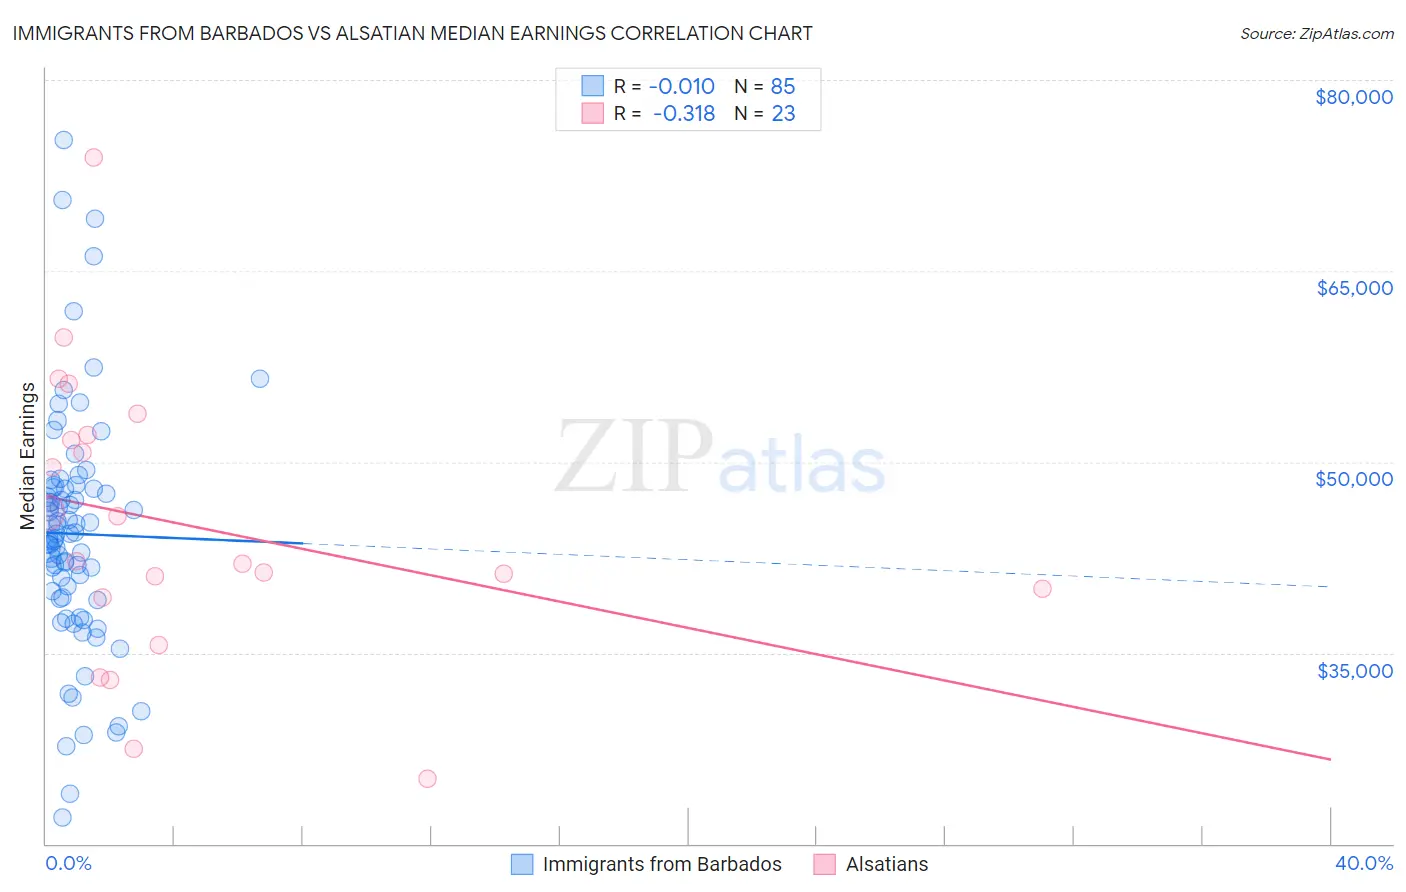
Immigrants from Barbados vs Alsatian Median Earnings Correlation Chart
The statistical analysis conducted on geographies consisting of 112,759,497 people shows no correlation between the proportion of Immigrants from Barbados and median earnings in the United States with a correlation coefficient (R) of -0.010 and weighted average of $45,816. Similarly, the statistical analysis conducted on geographies consisting of 82,677,221 people shows a mild negative correlation between the proportion of Alsatians and median earnings in the United States with a correlation coefficient (R) of -0.318 and weighted average of $47,023, a difference of 2.6%.
Median Earnings Correlation Summary
| Measurement | Immigrants from Barbados | Alsatian |
| Minimum | $22,067 | $25,064 |
| Maximum | $75,335 | $73,935 |
| Range | $53,268 | $48,871 |
| Mean | $44,348 | $45,093 |
| Median | $44,360 | $42,188 |
| Interquartile 25% (IQ1) | $39,293 | $39,345 |
| Interquartile 75% (IQ3) | $47,976 | $52,137 |
| Interquartile Range (IQR) | $8,683 | $12,792 |
| Standard Deviation (Sample) | $9,386 | $11,160 |
| Standard Deviation (Population) | $9,331 | $10,915 |
Similar Demographics by Median Earnings
Demographics Similar to Immigrants from Barbados by Median Earnings
In terms of median earnings, the demographic groups most similar to Immigrants from Barbados are Trinidadian and Tobagonian ($45,820, a difference of 0.010%), Immigrants from the Azores ($45,812, a difference of 0.010%), Barbadian ($45,846, a difference of 0.060%), Yugoslavian ($45,846, a difference of 0.070%), and Celtic ($45,732, a difference of 0.18%).
| Demographics | Rating | Rank | Median Earnings |
| Germans | 33.2 /100 | #192 | Fair $45,935 |
| Guamanians/Chamorros | 33.2 /100 | #193 | Fair $45,933 |
| Immigrants | Costa Rica | 33.0 /100 | #194 | Fair $45,928 |
| Immigrants | St. Vincent and the Grenadines | 32.4 /100 | #195 | Fair $45,908 |
| Yugoslavians | 30.5 /100 | #196 | Fair $45,846 |
| Barbadians | 30.5 /100 | #197 | Fair $45,846 |
| Trinidadians and Tobagonians | 29.7 /100 | #198 | Fair $45,820 |
| Immigrants | Barbados | 29.6 /100 | #199 | Fair $45,816 |
| Immigrants | Azores | 29.5 /100 | #200 | Fair $45,812 |
| Celtics | 27.2 /100 | #201 | Fair $45,732 |
| Immigrants | Trinidad and Tobago | 27.1 /100 | #202 | Fair $45,729 |
| Welsh | 26.6 /100 | #203 | Fair $45,710 |
| Immigrants | Uruguay | 25.9 /100 | #204 | Fair $45,682 |
| Tongans | 25.4 /100 | #205 | Fair $45,665 |
| Immigrants | Ghana | 24.8 /100 | #206 | Fair $45,641 |
Demographics Similar to Alsatians by Median Earnings
In terms of median earnings, the demographic groups most similar to Alsatians are Immigrants from Peru ($47,025, a difference of 0.0%), Immigrants from Eastern Africa ($46,969, a difference of 0.11%), Slovak ($47,095, a difference of 0.15%), South American Indian ($46,952, a difference of 0.15%), and Icelander ($46,916, a difference of 0.23%).
| Demographics | Rating | Rank | Median Earnings |
| Slavs | 81.1 /100 | #153 | Excellent $47,470 |
| Immigrants | Portugal | 77.3 /100 | #154 | Good $47,304 |
| Immigrants | Vietnam | 76.7 /100 | #155 | Good $47,282 |
| Irish | 76.6 /100 | #156 | Good $47,276 |
| Czechs | 75.1 /100 | #157 | Good $47,221 |
| Slovaks | 71.7 /100 | #158 | Good $47,095 |
| Immigrants | Peru | 69.6 /100 | #159 | Good $47,025 |
| Alsatians | 69.6 /100 | #160 | Good $47,023 |
| Immigrants | Eastern Africa | 68.0 /100 | #161 | Good $46,969 |
| South American Indians | 67.4 /100 | #162 | Good $46,952 |
| Icelanders | 66.3 /100 | #163 | Good $46,916 |
| Norwegians | 64.7 /100 | #164 | Good $46,865 |
| South Americans | 62.7 /100 | #165 | Good $46,804 |
| Czechoslovakians | 57.8 /100 | #166 | Average $46,658 |
| Costa Ricans | 57.4 /100 | #167 | Average $46,645 |