Sierra Leonean vs Mexican Median Family Income
COMPARE
Sierra Leonean
Mexican
Median Family Income
Median Family Income Comparison
Sierra Leoneans
Mexicans
$103,859
MEDIAN FAMILY INCOME
64.7/ 100
METRIC RATING
164th/ 347
METRIC RANK
$85,618
MEDIAN FAMILY INCOME
0.0/ 100
METRIC RATING
304th/ 347
METRIC RANK
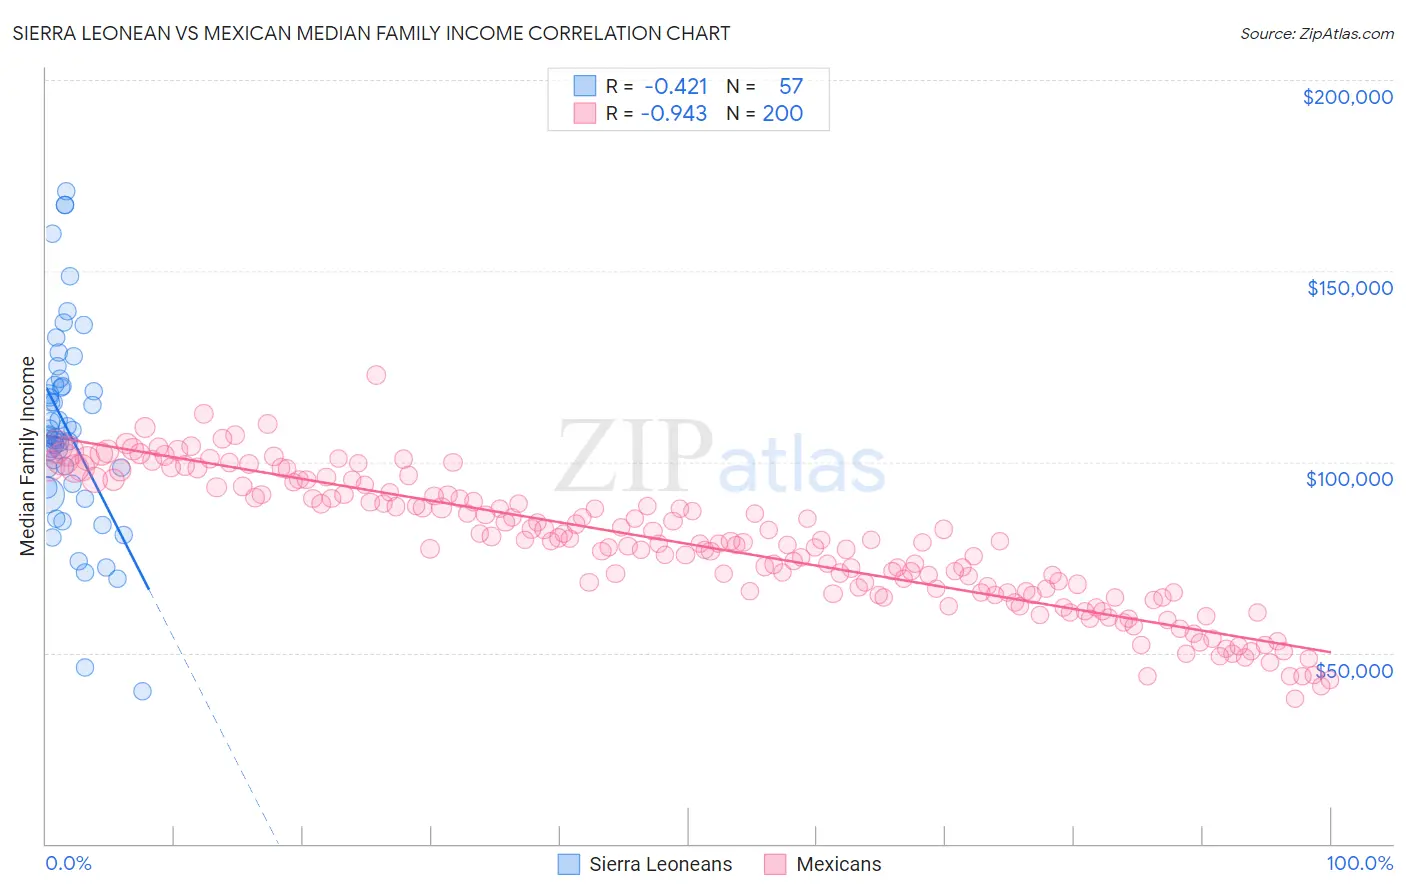
Sierra Leonean vs Mexican Median Family Income Correlation Chart
The statistical analysis conducted on geographies consisting of 83,335,449 people shows a moderate negative correlation between the proportion of Sierra Leoneans and median family income in the United States with a correlation coefficient (R) of -0.421 and weighted average of $103,859. Similarly, the statistical analysis conducted on geographies consisting of 563,853,219 people shows a near-perfect negative correlation between the proportion of Mexicans and median family income in the United States with a correlation coefficient (R) of -0.943 and weighted average of $85,618, a difference of 21.3%.
Median Family Income Correlation Summary
| Measurement | Sierra Leonean | Mexican |
| Minimum | $39,837 | $37,850 |
| Maximum | $170,916 | $122,714 |
| Range | $131,079 | $84,864 |
| Mean | $108,328 | $78,476 |
| Median | $106,551 | $78,807 |
| Interquartile 25% (IQ1) | $93,816 | $65,810 |
| Interquartile 75% (IQ3) | $120,017 | $91,475 |
| Interquartile Range (IQR) | $26,201 | $25,665 |
| Standard Deviation (Sample) | $26,389 | $17,414 |
| Standard Deviation (Population) | $26,156 | $17,371 |
Similar Demographics by Median Family Income
Demographics Similar to Sierra Leoneans by Median Family Income
In terms of median family income, the demographic groups most similar to Sierra Leoneans are Immigrants from Sierra Leone ($103,990, a difference of 0.13%), Costa Rican ($103,989, a difference of 0.13%), Slovak ($103,729, a difference of 0.13%), English ($103,684, a difference of 0.17%), and South American Indian ($103,624, a difference of 0.23%).
| Demographics | Rating | Rank | Median Family Income |
| Moroccans | 71.6 /100 | #157 | Good $104,488 |
| Scandinavians | 70.8 /100 | #158 | Good $104,410 |
| Swiss | 70.7 /100 | #159 | Good $104,396 |
| Scottish | 69.5 /100 | #160 | Good $104,288 |
| Icelanders | 69.4 /100 | #161 | Good $104,282 |
| Immigrants | Sierra Leone | 66.2 /100 | #162 | Good $103,990 |
| Costa Ricans | 66.2 /100 | #163 | Good $103,989 |
| Sierra Leoneans | 64.7 /100 | #164 | Good $103,859 |
| Slovaks | 63.1 /100 | #165 | Good $103,729 |
| English | 62.6 /100 | #166 | Good $103,684 |
| South American Indians | 61.9 /100 | #167 | Good $103,624 |
| Immigrants | Peru | 60.8 /100 | #168 | Good $103,534 |
| Czechoslovakians | 57.6 /100 | #169 | Average $103,273 |
| Immigrants | Uzbekistan | 56.6 /100 | #170 | Average $103,197 |
| Alsatians | 54.3 /100 | #171 | Average $103,010 |
Demographics Similar to Mexicans by Median Family Income
In terms of median family income, the demographic groups most similar to Mexicans are Hispanic or Latino ($85,647, a difference of 0.030%), Spanish American Indian ($85,728, a difference of 0.13%), Colville ($85,792, a difference of 0.20%), Paiute ($85,414, a difference of 0.24%), and Immigrants from Dominica ($85,411, a difference of 0.24%).
| Demographics | Rating | Rank | Median Family Income |
| Cajuns | 0.0 /100 | #297 | Tragic $87,157 |
| Immigrants | Latin America | 0.0 /100 | #298 | Tragic $86,989 |
| Chippewa | 0.0 /100 | #299 | Tragic $86,852 |
| Ottawa | 0.0 /100 | #300 | Tragic $86,380 |
| Colville | 0.0 /100 | #301 | Tragic $85,792 |
| Spanish American Indians | 0.0 /100 | #302 | Tragic $85,728 |
| Hispanics or Latinos | 0.0 /100 | #303 | Tragic $85,647 |
| Mexicans | 0.0 /100 | #304 | Tragic $85,618 |
| Paiute | 0.0 /100 | #305 | Tragic $85,414 |
| Immigrants | Dominica | 0.0 /100 | #306 | Tragic $85,411 |
| Chickasaw | 0.0 /100 | #307 | Tragic $85,356 |
| U.S. Virgin Islanders | 0.0 /100 | #308 | Tragic $85,294 |
| Haitians | 0.0 /100 | #309 | Tragic $85,218 |
| Immigrants | Central America | 0.0 /100 | #310 | Tragic $85,050 |
| Hondurans | 0.0 /100 | #311 | Tragic $85,004 |