Central American Indian vs Mexican Median Family Income
COMPARE
Central American Indian
Mexican
Median Family Income
Median Family Income Comparison
Central American Indians
Mexicans
$88,034
MEDIAN FAMILY INCOME
0.1/ 100
METRIC RATING
289th/ 347
METRIC RANK
$85,618
MEDIAN FAMILY INCOME
0.0/ 100
METRIC RATING
304th/ 347
METRIC RANK
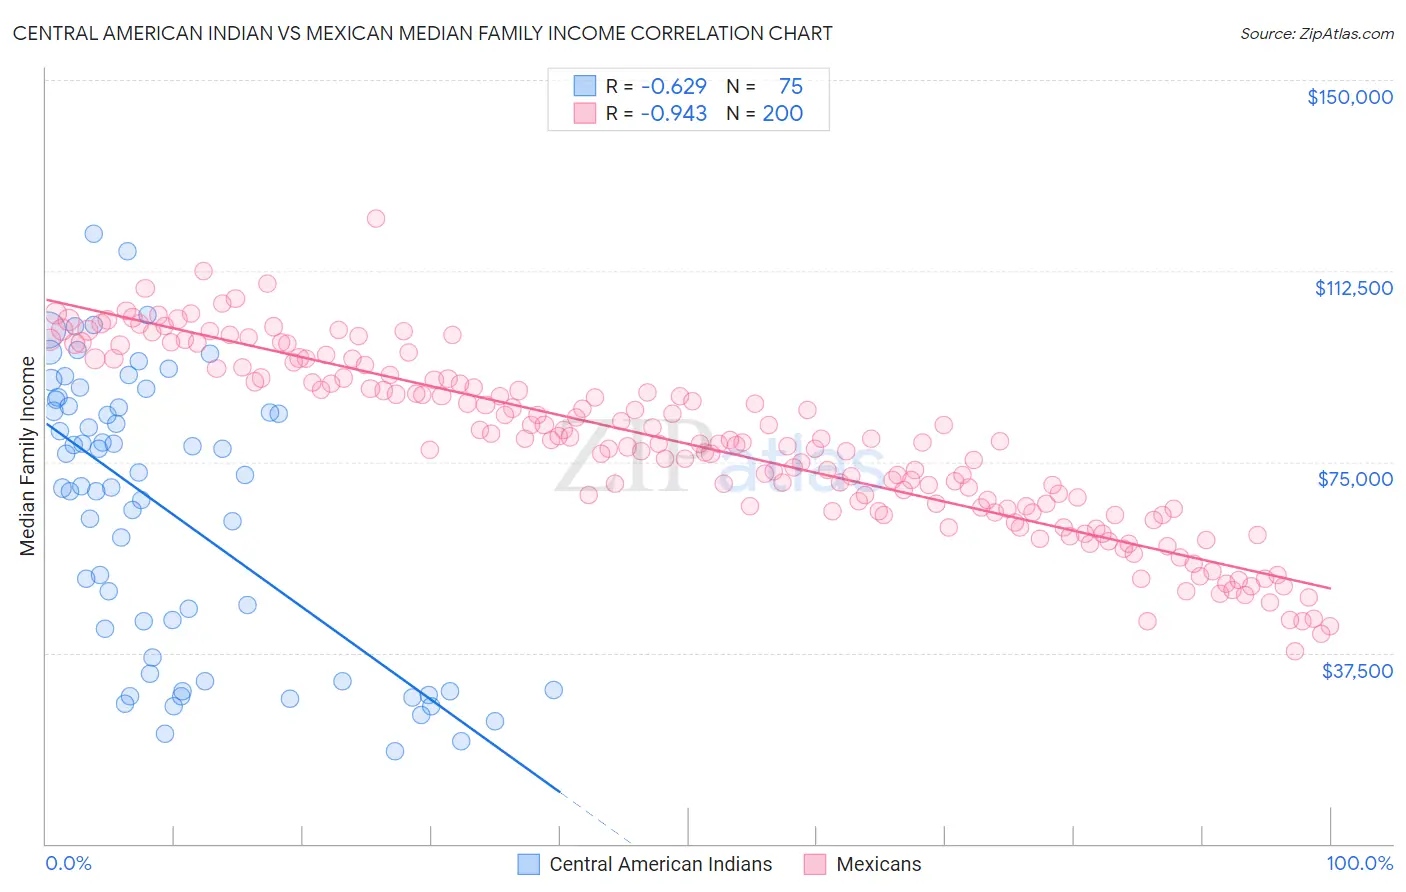
Central American Indian vs Mexican Median Family Income Correlation Chart
The statistical analysis conducted on geographies consisting of 326,005,427 people shows a significant negative correlation between the proportion of Central American Indians and median family income in the United States with a correlation coefficient (R) of -0.629 and weighted average of $88,034. Similarly, the statistical analysis conducted on geographies consisting of 563,853,219 people shows a near-perfect negative correlation between the proportion of Mexicans and median family income in the United States with a correlation coefficient (R) of -0.943 and weighted average of $85,618, a difference of 2.8%.
Median Family Income Correlation Summary
| Measurement | Central American Indian | Mexican |
| Minimum | $18,167 | $37,850 |
| Maximum | $119,681 | $122,714 |
| Range | $101,514 | $84,864 |
| Mean | $65,085 | $78,476 |
| Median | $70,092 | $78,807 |
| Interquartile 25% (IQ1) | $33,434 | $65,810 |
| Interquartile 75% (IQ3) | $85,864 | $91,475 |
| Interquartile Range (IQR) | $52,430 | $25,665 |
| Standard Deviation (Sample) | $27,378 | $17,414 |
| Standard Deviation (Population) | $27,195 | $17,371 |
Demographics Similar to Central American Indians and Mexicans by Median Family Income
In terms of median family income, the demographic groups most similar to Central American Indians are Shoshone ($87,872, a difference of 0.19%), Cherokee ($88,209, a difference of 0.20%), Immigrants from Cabo Verde ($87,830, a difference of 0.23%), African ($87,820, a difference of 0.24%), and Immigrants from Nicaragua ($88,267, a difference of 0.26%). Similarly, the demographic groups most similar to Mexicans are Hispanic or Latino ($85,647, a difference of 0.030%), Spanish American Indian ($85,728, a difference of 0.13%), Colville ($85,792, a difference of 0.20%), Paiute ($85,414, a difference of 0.24%), and Immigrants from Dominica ($85,411, a difference of 0.24%).
| Demographics | Rating | Rank | Median Family Income |
| Immigrants | Nicaragua | 0.1 /100 | #286 | Tragic $88,267 |
| Potawatomi | 0.1 /100 | #287 | Tragic $88,265 |
| Cherokee | 0.1 /100 | #288 | Tragic $88,209 |
| Central American Indians | 0.1 /100 | #289 | Tragic $88,034 |
| Shoshone | 0.1 /100 | #290 | Tragic $87,872 |
| Immigrants | Cabo Verde | 0.1 /100 | #291 | Tragic $87,830 |
| Africans | 0.1 /100 | #292 | Tragic $87,820 |
| Ute | 0.0 /100 | #293 | Tragic $87,596 |
| Fijians | 0.0 /100 | #294 | Tragic $87,387 |
| Yaqui | 0.0 /100 | #295 | Tragic $87,289 |
| Immigrants | Guatemala | 0.0 /100 | #296 | Tragic $87,191 |
| Cajuns | 0.0 /100 | #297 | Tragic $87,157 |
| Immigrants | Latin America | 0.0 /100 | #298 | Tragic $86,989 |
| Chippewa | 0.0 /100 | #299 | Tragic $86,852 |
| Ottawa | 0.0 /100 | #300 | Tragic $86,380 |
| Colville | 0.0 /100 | #301 | Tragic $85,792 |
| Spanish American Indians | 0.0 /100 | #302 | Tragic $85,728 |
| Hispanics or Latinos | 0.0 /100 | #303 | Tragic $85,647 |
| Mexicans | 0.0 /100 | #304 | Tragic $85,618 |
| Paiute | 0.0 /100 | #305 | Tragic $85,414 |
| Immigrants | Dominica | 0.0 /100 | #306 | Tragic $85,411 |