Swiss vs Mexican Median Family Income
COMPARE
Swiss
Mexican
Median Family Income
Median Family Income Comparison
Swiss
Mexicans
$104,396
MEDIAN FAMILY INCOME
70.7/ 100
METRIC RATING
159th/ 347
METRIC RANK
$85,618
MEDIAN FAMILY INCOME
0.0/ 100
METRIC RATING
304th/ 347
METRIC RANK
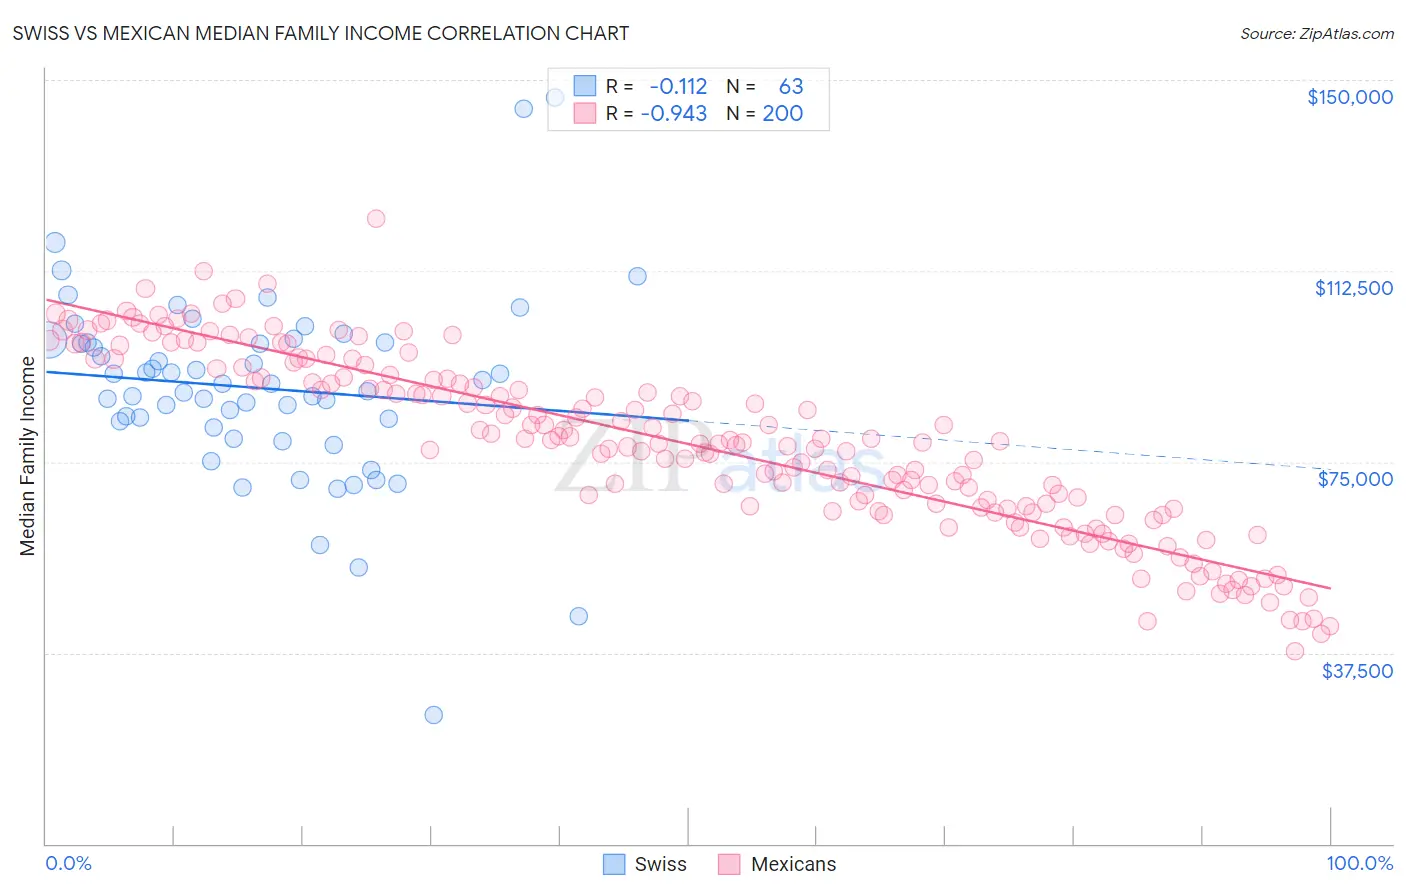
Swiss vs Mexican Median Family Income Correlation Chart
The statistical analysis conducted on geographies consisting of 464,558,670 people shows a poor negative correlation between the proportion of Swiss and median family income in the United States with a correlation coefficient (R) of -0.112 and weighted average of $104,396. Similarly, the statistical analysis conducted on geographies consisting of 563,853,219 people shows a near-perfect negative correlation between the proportion of Mexicans and median family income in the United States with a correlation coefficient (R) of -0.943 and weighted average of $85,618, a difference of 21.9%.
Median Family Income Correlation Summary
| Measurement | Swiss | Mexican |
| Minimum | $25,401 | $37,850 |
| Maximum | $146,603 | $122,714 |
| Range | $121,202 | $84,864 |
| Mean | $89,459 | $78,476 |
| Median | $90,414 | $78,807 |
| Interquartile 25% (IQ1) | $81,791 | $65,810 |
| Interquartile 75% (IQ3) | $98,522 | $91,475 |
| Interquartile Range (IQR) | $16,731 | $25,665 |
| Standard Deviation (Sample) | $18,875 | $17,414 |
| Standard Deviation (Population) | $18,724 | $17,371 |
Similar Demographics by Median Family Income
Demographics Similar to Swiss by Median Family Income
In terms of median family income, the demographic groups most similar to Swiss are Scandinavian ($104,410, a difference of 0.010%), Moroccan ($104,488, a difference of 0.090%), Scottish ($104,288, a difference of 0.10%), Icelander ($104,282, a difference of 0.11%), and Basque ($104,760, a difference of 0.35%).
| Demographics | Rating | Rank | Median Family Income |
| Immigrants | Albania | 79.1 /100 | #152 | Good $105,285 |
| Slavs | 77.9 /100 | #153 | Good $105,144 |
| Immigrants | Nepal | 76.3 /100 | #154 | Good $104,966 |
| Native Hawaiians | 75.8 /100 | #155 | Good $104,910 |
| Basques | 74.4 /100 | #156 | Good $104,760 |
| Moroccans | 71.6 /100 | #157 | Good $104,488 |
| Scandinavians | 70.8 /100 | #158 | Good $104,410 |
| Swiss | 70.7 /100 | #159 | Good $104,396 |
| Scottish | 69.5 /100 | #160 | Good $104,288 |
| Icelanders | 69.4 /100 | #161 | Good $104,282 |
| Immigrants | Sierra Leone | 66.2 /100 | #162 | Good $103,990 |
| Costa Ricans | 66.2 /100 | #163 | Good $103,989 |
| Sierra Leoneans | 64.7 /100 | #164 | Good $103,859 |
| Slovaks | 63.1 /100 | #165 | Good $103,729 |
| English | 62.6 /100 | #166 | Good $103,684 |
Demographics Similar to Mexicans by Median Family Income
In terms of median family income, the demographic groups most similar to Mexicans are Hispanic or Latino ($85,647, a difference of 0.030%), Spanish American Indian ($85,728, a difference of 0.13%), Colville ($85,792, a difference of 0.20%), Paiute ($85,414, a difference of 0.24%), and Immigrants from Dominica ($85,411, a difference of 0.24%).
| Demographics | Rating | Rank | Median Family Income |
| Cajuns | 0.0 /100 | #297 | Tragic $87,157 |
| Immigrants | Latin America | 0.0 /100 | #298 | Tragic $86,989 |
| Chippewa | 0.0 /100 | #299 | Tragic $86,852 |
| Ottawa | 0.0 /100 | #300 | Tragic $86,380 |
| Colville | 0.0 /100 | #301 | Tragic $85,792 |
| Spanish American Indians | 0.0 /100 | #302 | Tragic $85,728 |
| Hispanics or Latinos | 0.0 /100 | #303 | Tragic $85,647 |
| Mexicans | 0.0 /100 | #304 | Tragic $85,618 |
| Paiute | 0.0 /100 | #305 | Tragic $85,414 |
| Immigrants | Dominica | 0.0 /100 | #306 | Tragic $85,411 |
| Chickasaw | 0.0 /100 | #307 | Tragic $85,356 |
| U.S. Virgin Islanders | 0.0 /100 | #308 | Tragic $85,294 |
| Haitians | 0.0 /100 | #309 | Tragic $85,218 |
| Immigrants | Central America | 0.0 /100 | #310 | Tragic $85,050 |
| Hondurans | 0.0 /100 | #311 | Tragic $85,004 |