Romanian vs Iraqi In Labor Force | Age 30-34
COMPARE
Romanian
Iraqi
In Labor Force | Age 30-34
In Labor Force | Age 30-34 Comparison
Romanians
Iraqis
84.8%
IN LABOR FORCE | AGE 30-34
73.5/ 100
METRIC RATING
152nd/ 347
METRIC RANK
83.8%
IN LABOR FORCE | AGE 30-34
0.3/ 100
METRIC RATING
257th/ 347
METRIC RANK
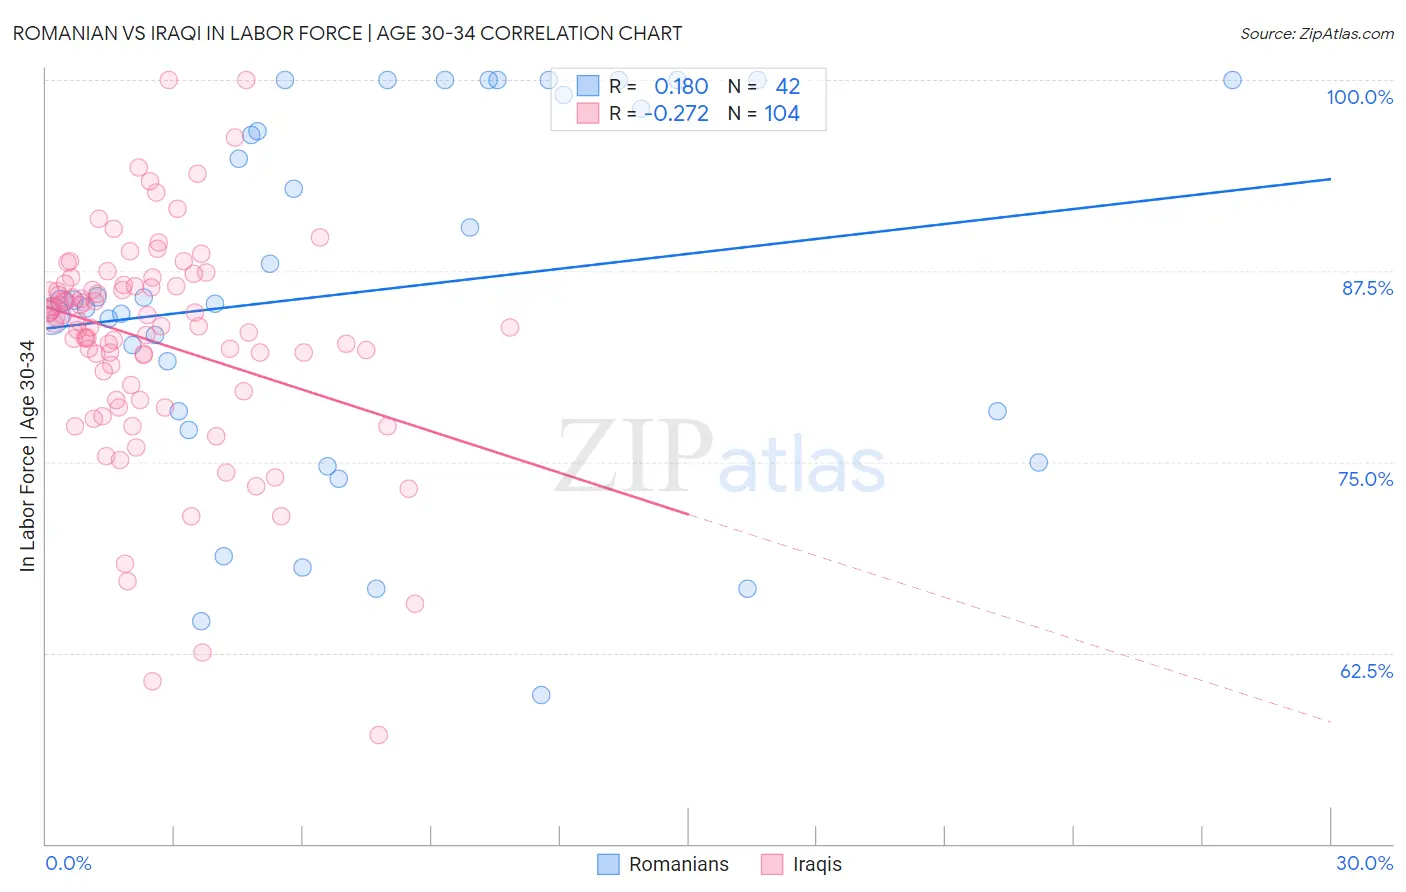
Romanian vs Iraqi In Labor Force | Age 30-34 Correlation Chart
The statistical analysis conducted on geographies consisting of 377,700,007 people shows a poor positive correlation between the proportion of Romanians and labor force participation rate among population between the ages 30 and 34 in the United States with a correlation coefficient (R) of 0.180 and weighted average of 84.8%. Similarly, the statistical analysis conducted on geographies consisting of 170,642,929 people shows a weak negative correlation between the proportion of Iraqis and labor force participation rate among population between the ages 30 and 34 in the United States with a correlation coefficient (R) of -0.272 and weighted average of 83.8%, a difference of 1.2%.
In Labor Force | Age 30-34 Correlation Summary
| Measurement | Romanian | Iraqi |
| Minimum | 59.7% | 57.1% |
| Maximum | 100.0% | 100.0% |
| Range | 40.3% | 42.9% |
| Mean | 86.2% | 82.9% |
| Median | 85.6% | 84.0% |
| Interquartile 25% (IQ1) | 78.3% | 79.8% |
| Interquartile 75% (IQ3) | 99.0% | 86.5% |
| Interquartile Range (IQR) | 20.7% | 6.7% |
| Standard Deviation (Sample) | 11.9% | 7.2% |
| Standard Deviation (Population) | 11.7% | 7.2% |
Similar Demographics by In Labor Force | Age 30-34
Demographics Similar to Romanians by In Labor Force | Age 30-34
In terms of in labor force | age 30-34, the demographic groups most similar to Romanians are Immigrants from Senegal (84.8%, a difference of 0.0%), German (84.8%, a difference of 0.010%), Immigrants from Ukraine (84.8%, a difference of 0.020%), Immigrants from Saudi Arabia (84.9%, a difference of 0.030%), and Immigrants from Colombia (84.9%, a difference of 0.030%).
| Demographics | Rating | Rank | In Labor Force | Age 30-34 |
| Palestinians | 77.7 /100 | #145 | Good 84.9% |
| Immigrants | Saudi Arabia | 76.6 /100 | #146 | Good 84.9% |
| Immigrants | Colombia | 76.3 /100 | #147 | Good 84.9% |
| Immigrants | Pakistan | 76.2 /100 | #148 | Good 84.9% |
| Immigrants | Ukraine | 75.1 /100 | #149 | Good 84.8% |
| Germans | 75.1 /100 | #150 | Good 84.8% |
| Immigrants | Senegal | 74.0 /100 | #151 | Good 84.8% |
| Romanians | 73.5 /100 | #152 | Good 84.8% |
| Syrians | 70.1 /100 | #153 | Good 84.8% |
| Northern Europeans | 70.0 /100 | #154 | Good 84.8% |
| Immigrants | Sudan | 69.5 /100 | #155 | Good 84.8% |
| French Canadians | 67.3 /100 | #156 | Good 84.8% |
| Peruvians | 65.9 /100 | #157 | Good 84.8% |
| Immigrants | Armenia | 64.7 /100 | #158 | Good 84.8% |
| Czechoslovakians | 63.0 /100 | #159 | Good 84.8% |
Demographics Similar to Iraqis by In Labor Force | Age 30-34
In terms of in labor force | age 30-34, the demographic groups most similar to Iraqis are Immigrants from Lebanon (83.9%, a difference of 0.010%), Honduran (83.8%, a difference of 0.030%), Scotch-Irish (83.8%, a difference of 0.030%), Immigrants from Dominican Republic (83.8%, a difference of 0.050%), and White/Caucasian (83.9%, a difference of 0.060%).
| Demographics | Rating | Rank | In Labor Force | Age 30-34 |
| Immigrants | Iraq | 0.7 /100 | #250 | Tragic 83.9% |
| Nicaraguans | 0.6 /100 | #251 | Tragic 83.9% |
| Bahamians | 0.6 /100 | #252 | Tragic 83.9% |
| Immigrants | Nicaragua | 0.6 /100 | #253 | Tragic 83.9% |
| Immigrants | St. Vincent and the Grenadines | 0.5 /100 | #254 | Tragic 83.9% |
| Whites/Caucasians | 0.5 /100 | #255 | Tragic 83.9% |
| Immigrants | Lebanon | 0.4 /100 | #256 | Tragic 83.9% |
| Iraqis | 0.3 /100 | #257 | Tragic 83.8% |
| Hondurans | 0.3 /100 | #258 | Tragic 83.8% |
| Scotch-Irish | 0.3 /100 | #259 | Tragic 83.8% |
| Immigrants | Dominican Republic | 0.3 /100 | #260 | Tragic 83.8% |
| Guyanese | 0.3 /100 | #261 | Tragic 83.8% |
| Dominicans | 0.2 /100 | #262 | Tragic 83.8% |
| Immigrants | Guyana | 0.2 /100 | #263 | Tragic 83.8% |
| Guatemalans | 0.2 /100 | #264 | Tragic 83.7% |