Puerto Rican vs Subsaharan African 7th Grade
COMPARE
Puerto Rican
Subsaharan African
7th Grade
7th Grade Comparison
Puerto Ricans
Sub-Saharan Africans
94.0%
7TH GRADE
0.0/ 100
METRIC RATING
311th/ 347
METRIC RANK
95.7%
7TH GRADE
7.2/ 100
METRIC RATING
220th/ 347
METRIC RANK
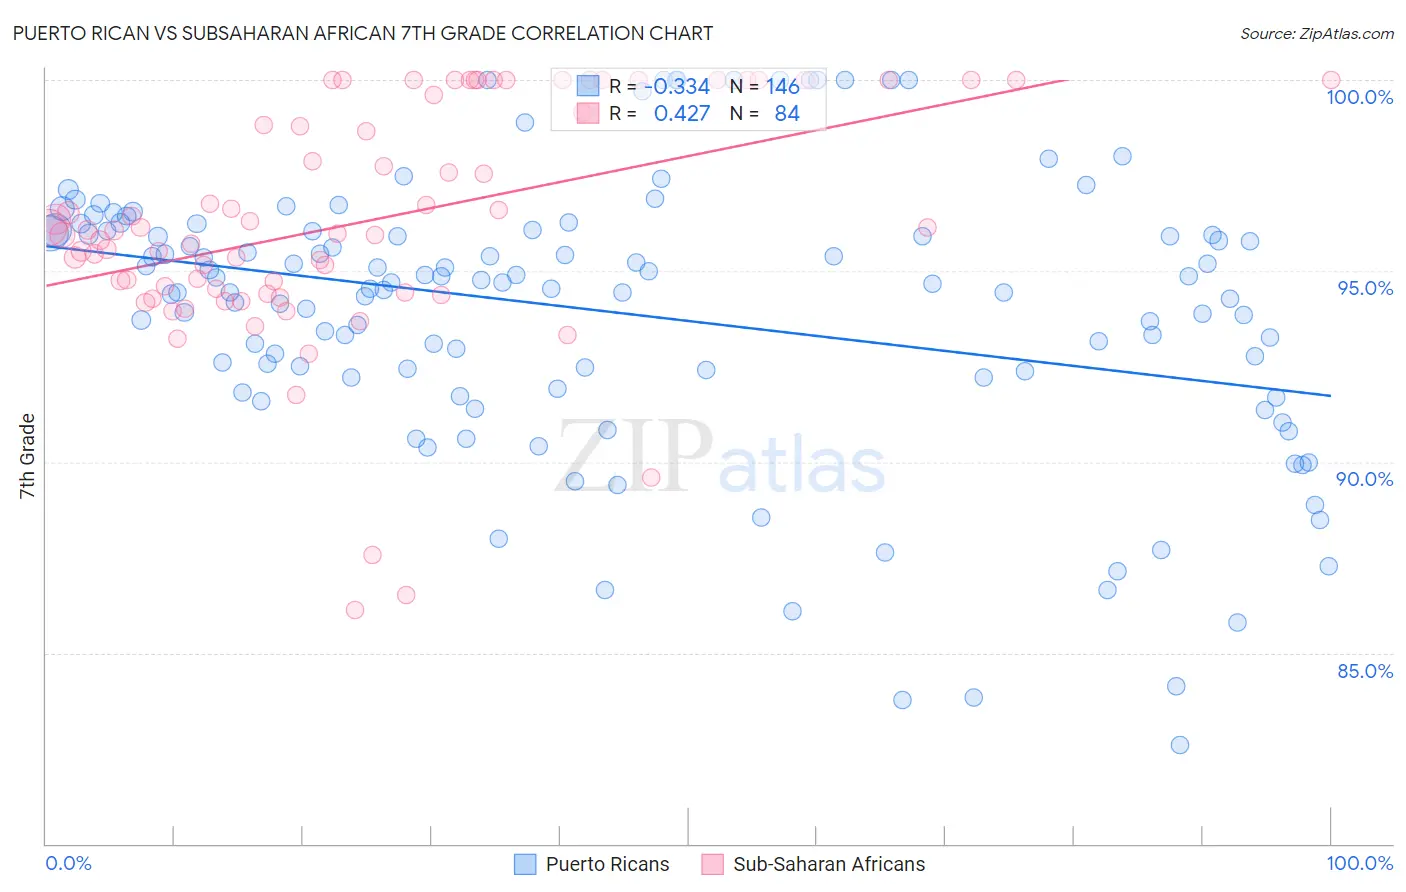
Puerto Rican vs Subsaharan African 7th Grade Correlation Chart
The statistical analysis conducted on geographies consisting of 528,319,832 people shows a mild negative correlation between the proportion of Puerto Ricans and percentage of population with at least 7th grade education in the United States with a correlation coefficient (R) of -0.334 and weighted average of 94.0%. Similarly, the statistical analysis conducted on geographies consisting of 508,210,020 people shows a moderate positive correlation between the proportion of Sub-Saharan Africans and percentage of population with at least 7th grade education in the United States with a correlation coefficient (R) of 0.427 and weighted average of 95.7%, a difference of 1.7%.
7th Grade Correlation Summary
| Measurement | Puerto Rican | Subsaharan African |
| Minimum | 82.6% | 86.1% |
| Maximum | 100.0% | 100.0% |
| Range | 17.4% | 13.9% |
| Mean | 93.9% | 96.3% |
| Median | 94.6% | 96.1% |
| Interquartile 25% (IQ1) | 92.2% | 94.5% |
| Interquartile 75% (IQ3) | 96.0% | 99.8% |
| Interquartile Range (IQR) | 3.8% | 5.3% |
| Standard Deviation (Sample) | 3.6% | 3.1% |
| Standard Deviation (Population) | 3.6% | 3.1% |
Similar Demographics by 7th Grade
Demographics Similar to Puerto Ricans by 7th Grade
In terms of 7th grade, the demographic groups most similar to Puerto Ricans are Immigrants from Caribbean (94.0%, a difference of 0.010%), Ecuadorian (94.0%, a difference of 0.020%), Immigrants (94.0%, a difference of 0.040%), Immigrants from Bangladesh (94.0%, a difference of 0.040%), and Japanese (94.0%, a difference of 0.070%).
| Demographics | Rating | Rank | 7th Grade |
| Immigrants | Haiti | 0.0 /100 | #304 | Tragic 94.3% |
| Guyanese | 0.0 /100 | #305 | Tragic 94.3% |
| Immigrants | Guyana | 0.0 /100 | #306 | Tragic 94.2% |
| Immigrants | Portugal | 0.0 /100 | #307 | Tragic 94.2% |
| Cape Verdeans | 0.0 /100 | #308 | Tragic 94.1% |
| Ecuadorians | 0.0 /100 | #309 | Tragic 94.0% |
| Immigrants | Caribbean | 0.0 /100 | #310 | Tragic 94.0% |
| Puerto Ricans | 0.0 /100 | #311 | Tragic 94.0% |
| Immigrants | Immigrants | 0.0 /100 | #312 | Tragic 94.0% |
| Immigrants | Bangladesh | 0.0 /100 | #313 | Tragic 94.0% |
| Japanese | 0.0 /100 | #314 | Tragic 94.0% |
| Vietnamese | 0.0 /100 | #315 | Tragic 93.9% |
| Immigrants | Vietnam | 0.0 /100 | #316 | Tragic 93.9% |
| Immigrants | Cuba | 0.0 /100 | #317 | Tragic 93.8% |
| Immigrants | Ecuador | 0.0 /100 | #318 | Tragic 93.7% |
Demographics Similar to Sub-Saharan Africans by 7th Grade
In terms of 7th grade, the demographic groups most similar to Sub-Saharan Africans are Samoan (95.7%, a difference of 0.0%), Laotian (95.7%, a difference of 0.010%), Immigrants from Syria (95.7%, a difference of 0.010%), Immigrants from Oceania (95.7%, a difference of 0.010%), and Immigrants from Liberia (95.7%, a difference of 0.020%).
| Demographics | Rating | Rank | 7th Grade |
| Immigrants | Morocco | 12.6 /100 | #213 | Poor 95.8% |
| Bahamians | 11.6 /100 | #214 | Poor 95.7% |
| Spanish Americans | 9.3 /100 | #215 | Tragic 95.7% |
| Immigrants | Chile | 9.1 /100 | #216 | Tragic 95.7% |
| Immigrants | Pakistan | 9.0 /100 | #217 | Tragic 95.7% |
| Immigrants | Liberia | 8.1 /100 | #218 | Tragic 95.7% |
| Immigrants | Southern Europe | 7.9 /100 | #219 | Tragic 95.7% |
| Sub-Saharan Africans | 7.2 /100 | #220 | Tragic 95.7% |
| Samoans | 7.0 /100 | #221 | Tragic 95.7% |
| Laotians | 6.8 /100 | #222 | Tragic 95.7% |
| Immigrants | Syria | 6.7 /100 | #223 | Tragic 95.7% |
| Immigrants | Oceania | 6.7 /100 | #224 | Tragic 95.7% |
| Immigrants | Malaysia | 6.2 /100 | #225 | Tragic 95.6% |
| Immigrants | Eastern Asia | 5.8 /100 | #226 | Tragic 95.6% |
| Immigrants | Western Asia | 5.4 /100 | #227 | Tragic 95.6% |