Venezuelan vs Samoan Median Male Earnings
COMPARE
Venezuelan
Samoan
Median Male Earnings
Median Male Earnings Comparison
Venezuelans
Samoans
$52,510
MEDIAN MALE EARNINGS
12.5/ 100
METRIC RATING
208th/ 347
METRIC RANK
$51,389
MEDIAN MALE EARNINGS
4.6/ 100
METRIC RATING
228th/ 347
METRIC RANK
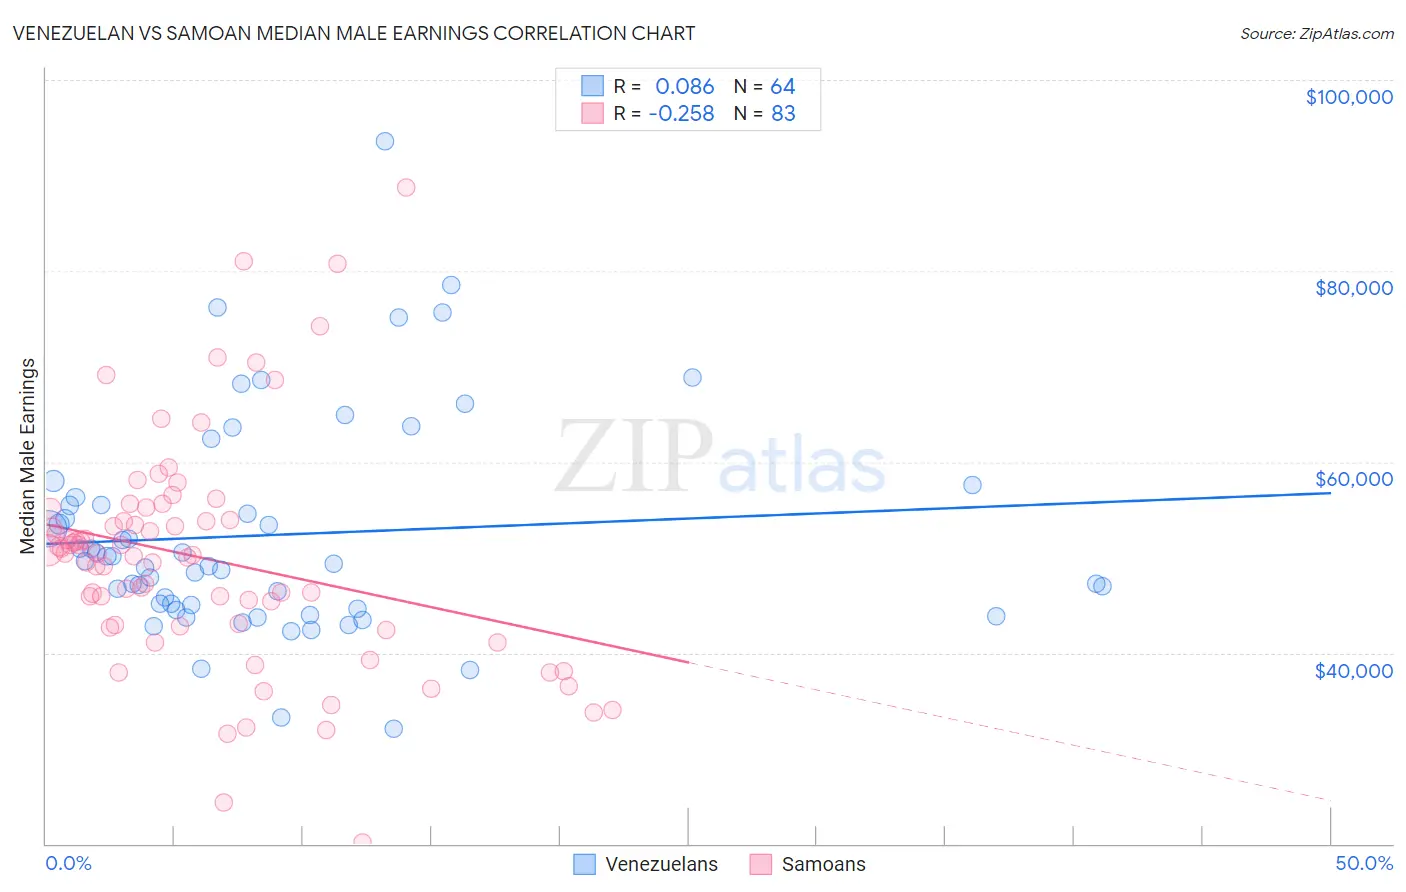
Venezuelan vs Samoan Median Male Earnings Correlation Chart
The statistical analysis conducted on geographies consisting of 306,273,362 people shows a slight positive correlation between the proportion of Venezuelans and median male earnings in the United States with a correlation coefficient (R) of 0.086 and weighted average of $52,510. Similarly, the statistical analysis conducted on geographies consisting of 225,157,304 people shows a weak negative correlation between the proportion of Samoans and median male earnings in the United States with a correlation coefficient (R) of -0.258 and weighted average of $51,389, a difference of 2.2%.
Median Male Earnings Correlation Summary
| Measurement | Venezuelan | Samoan |
| Minimum | $32,054 | $20,179 |
| Maximum | $93,535 | $88,750 |
| Range | $61,481 | $68,571 |
| Mean | $52,370 | $49,891 |
| Median | $49,459 | $50,415 |
| Interquartile 25% (IQ1) | $44,807 | $42,816 |
| Interquartile 75% (IQ3) | $55,925 | $53,887 |
| Interquartile Range (IQR) | $11,117 | $11,071 |
| Standard Deviation (Sample) | $11,420 | $11,942 |
| Standard Deviation (Population) | $11,330 | $11,870 |
Demographics Similar to Venezuelans and Samoans by Median Male Earnings
In terms of median male earnings, the demographic groups most similar to Venezuelans are Bermudan ($52,465, a difference of 0.090%), Delaware ($52,412, a difference of 0.19%), Tlingit-Haida ($52,409, a difference of 0.19%), Cajun ($52,325, a difference of 0.35%), and Native Hawaiian ($52,306, a difference of 0.39%). Similarly, the demographic groups most similar to Samoans are Trinidadian and Tobagonian ($51,446, a difference of 0.11%), Japanese ($51,473, a difference of 0.16%), Immigrants from Sudan ($51,489, a difference of 0.19%), Ecuadorian ($51,596, a difference of 0.40%), and Immigrants from Cambodia ($51,594, a difference of 0.40%).
| Demographics | Rating | Rank | Median Male Earnings |
| Venezuelans | 12.5 /100 | #208 | Poor $52,510 |
| Bermudans | 12.1 /100 | #209 | Poor $52,465 |
| Delaware | 11.5 /100 | #210 | Poor $52,412 |
| Tlingit-Haida | 11.5 /100 | #211 | Poor $52,409 |
| Cajuns | 10.7 /100 | #212 | Poor $52,325 |
| Native Hawaiians | 10.5 /100 | #213 | Poor $52,306 |
| Immigrants | Nonimmigrants | 9.3 /100 | #214 | Tragic $52,170 |
| Immigrants | Cameroon | 8.9 /100 | #215 | Tragic $52,119 |
| Immigrants | Venezuela | 8.3 /100 | #216 | Tragic $52,041 |
| Nigerians | 8.3 /100 | #217 | Tragic $52,039 |
| Immigrants | Panama | 7.7 /100 | #218 | Tragic $51,962 |
| Immigrants | Ghana | 6.9 /100 | #219 | Tragic $51,836 |
| Immigrants | Armenia | 6.6 /100 | #220 | Tragic $51,793 |
| Immigrants | Senegal | 5.8 /100 | #221 | Tragic $51,647 |
| Immigrants | Bangladesh | 5.8 /100 | #222 | Tragic $51,642 |
| Ecuadorians | 5.5 /100 | #223 | Tragic $51,596 |
| Immigrants | Cambodia | 5.5 /100 | #224 | Tragic $51,594 |
| Immigrants | Sudan | 5.0 /100 | #225 | Tragic $51,489 |
| Japanese | 4.9 /100 | #226 | Tragic $51,473 |
| Trinidadians and Tobagonians | 4.8 /100 | #227 | Tragic $51,446 |
| Samoans | 4.6 /100 | #228 | Tragic $51,389 |