Indonesian vs Immigrants from Kenya Per Capita Income
COMPARE
Indonesian
Immigrants from Kenya
Per Capita Income
Per Capita Income Comparison
Indonesians
Immigrants from Kenya
$37,300
PER CAPITA INCOME
0.1/ 100
METRIC RATING
296th/ 347
METRIC RANK
$42,661
PER CAPITA INCOME
24.5/ 100
METRIC RATING
195th/ 347
METRIC RANK
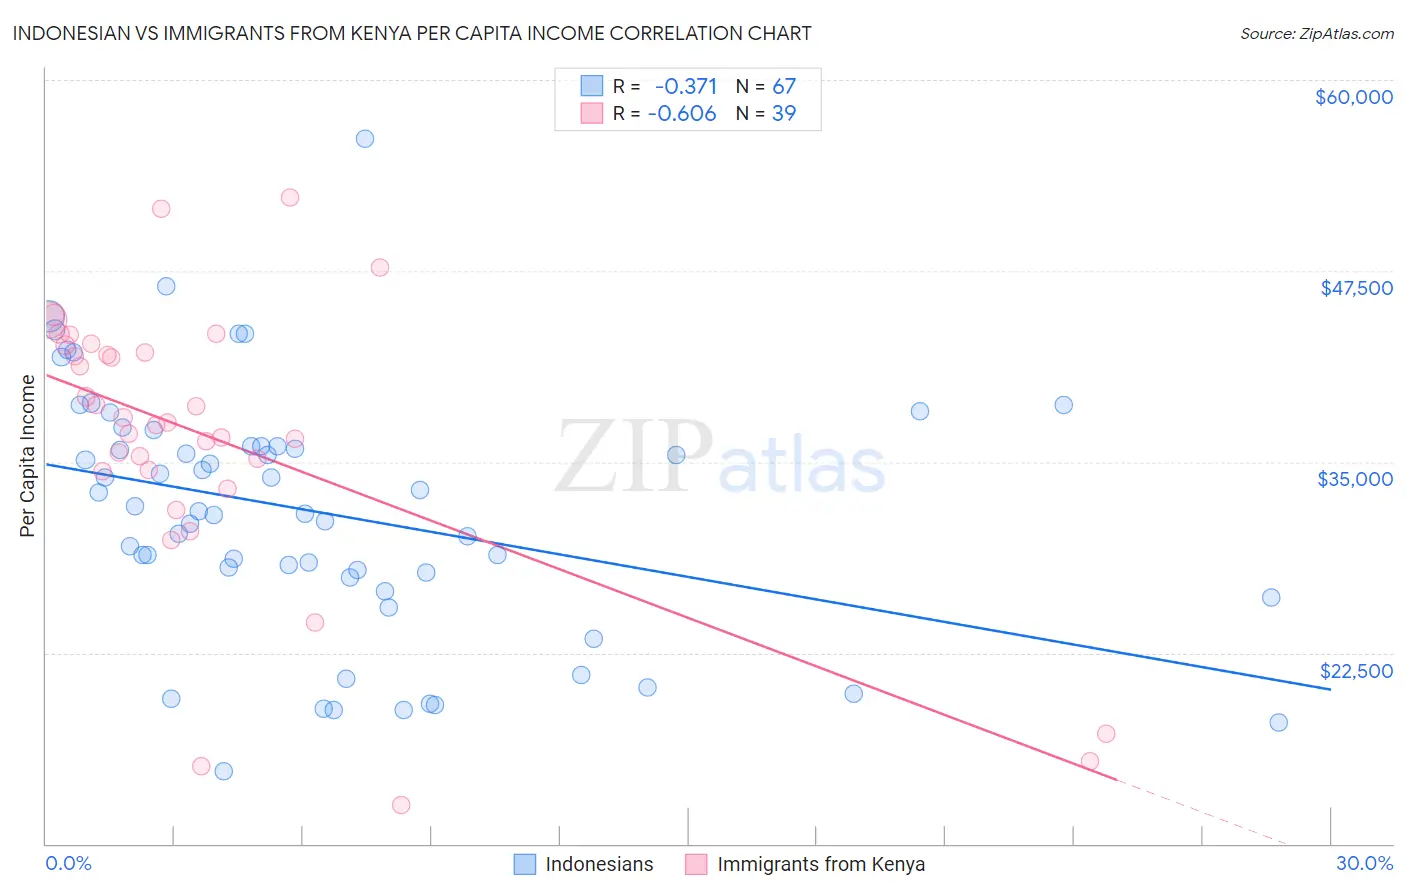
Indonesian vs Immigrants from Kenya Per Capita Income Correlation Chart
The statistical analysis conducted on geographies consisting of 162,740,842 people shows a mild negative correlation between the proportion of Indonesians and per capita income in the United States with a correlation coefficient (R) of -0.371 and weighted average of $37,300. Similarly, the statistical analysis conducted on geographies consisting of 218,088,473 people shows a significant negative correlation between the proportion of Immigrants from Kenya and per capita income in the United States with a correlation coefficient (R) of -0.606 and weighted average of $42,661, a difference of 14.4%.
Per Capita Income Correlation Summary
| Measurement | Indonesian | Immigrants from Kenya |
| Minimum | $14,779 | $12,576 |
| Maximum | $56,163 | $52,346 |
| Range | $41,384 | $39,770 |
| Mean | $31,679 | $36,572 |
| Median | $31,763 | $37,555 |
| Interquartile 25% (IQ1) | $27,405 | $34,356 |
| Interquartile 75% (IQ3) | $36,017 | $42,624 |
| Interquartile Range (IQR) | $8,612 | $8,268 |
| Standard Deviation (Sample) | $8,209 | $9,228 |
| Standard Deviation (Population) | $8,147 | $9,109 |
Similar Demographics by Per Capita Income
Demographics Similar to Indonesians by Per Capita Income
In terms of per capita income, the demographic groups most similar to Indonesians are Immigrants from Dominican Republic ($37,306, a difference of 0.020%), Haitian ($37,289, a difference of 0.030%), Immigrants from Caribbean ($37,254, a difference of 0.12%), Cuban ($37,383, a difference of 0.22%), and Cherokee ($37,203, a difference of 0.26%).
| Demographics | Rating | Rank | Per Capita Income |
| U.S. Virgin Islanders | 0.1 /100 | #289 | Tragic $37,589 |
| Immigrants | Guatemala | 0.1 /100 | #290 | Tragic $37,550 |
| Cajuns | 0.1 /100 | #291 | Tragic $37,527 |
| Immigrants | Micronesia | 0.1 /100 | #292 | Tragic $37,464 |
| Mexican American Indians | 0.1 /100 | #293 | Tragic $37,407 |
| Cubans | 0.1 /100 | #294 | Tragic $37,383 |
| Immigrants | Dominican Republic | 0.1 /100 | #295 | Tragic $37,306 |
| Indonesians | 0.1 /100 | #296 | Tragic $37,300 |
| Haitians | 0.1 /100 | #297 | Tragic $37,289 |
| Immigrants | Caribbean | 0.1 /100 | #298 | Tragic $37,254 |
| Cherokee | 0.1 /100 | #299 | Tragic $37,203 |
| Immigrants | Bahamas | 0.1 /100 | #300 | Tragic $37,193 |
| Ottawa | 0.1 /100 | #301 | Tragic $37,101 |
| Shoshone | 0.1 /100 | #302 | Tragic $37,072 |
| Paiute | 0.1 /100 | #303 | Tragic $37,066 |
Demographics Similar to Immigrants from Kenya by Per Capita Income
In terms of per capita income, the demographic groups most similar to Immigrants from Kenya are Immigrants from Fiji ($42,694, a difference of 0.080%), Dutch ($42,605, a difference of 0.13%), Immigrants from Sierra Leone ($42,752, a difference of 0.21%), Iraqi ($42,760, a difference of 0.23%), and Scotch-Irish ($42,563, a difference of 0.23%).
| Demographics | Rating | Rank | Per Capita Income |
| Immigrants | Africa | 31.0 /100 | #188 | Fair $42,950 |
| Bermudans | 30.1 /100 | #189 | Fair $42,911 |
| Kenyans | 27.7 /100 | #190 | Fair $42,808 |
| Yugoslavians | 27.4 /100 | #191 | Fair $42,792 |
| Iraqis | 26.7 /100 | #192 | Fair $42,760 |
| Immigrants | Sierra Leone | 26.5 /100 | #193 | Fair $42,752 |
| Immigrants | Fiji | 25.2 /100 | #194 | Fair $42,694 |
| Immigrants | Kenya | 24.5 /100 | #195 | Fair $42,661 |
| Dutch | 23.4 /100 | #196 | Fair $42,605 |
| Scotch-Irish | 22.6 /100 | #197 | Fair $42,563 |
| Immigrants | Portugal | 19.7 /100 | #198 | Poor $42,412 |
| Barbadians | 19.6 /100 | #199 | Poor $42,406 |
| Vietnamese | 19.0 /100 | #200 | Poor $42,368 |
| Immigrants | Thailand | 17.6 /100 | #201 | Poor $42,289 |
| Immigrants | Bosnia and Herzegovina | 17.5 /100 | #202 | Poor $42,278 |