Panamanian vs Immigrants from Kenya Per Capita Income
COMPARE
Panamanian
Immigrants from Kenya
Per Capita Income
Per Capita Income Comparison
Panamanians
Immigrants from Kenya
$42,035
PER CAPITA INCOME
13.9/ 100
METRIC RATING
208th/ 347
METRIC RANK
$42,661
PER CAPITA INCOME
24.5/ 100
METRIC RATING
195th/ 347
METRIC RANK
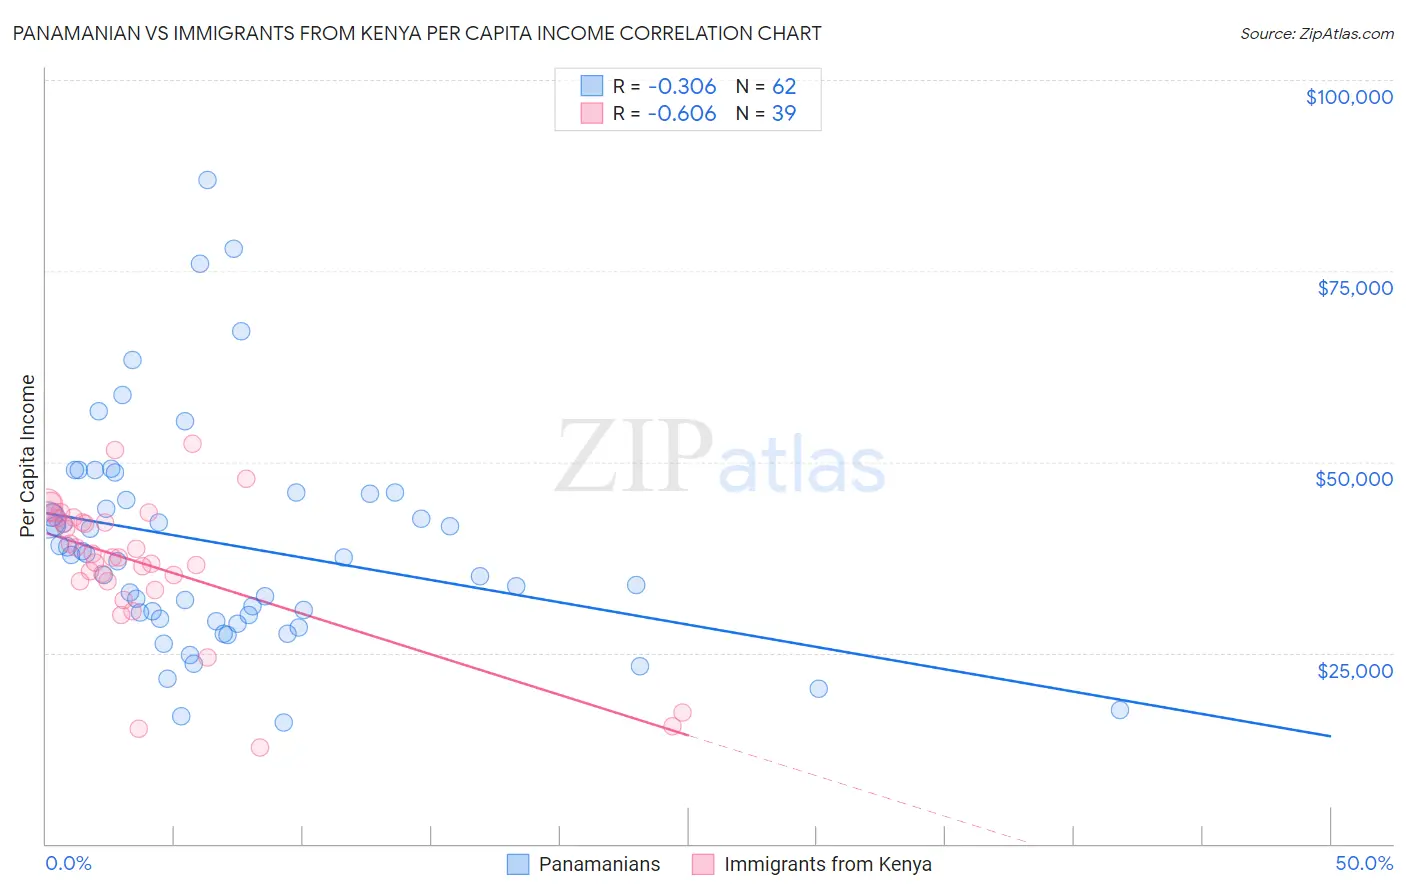
Panamanian vs Immigrants from Kenya Per Capita Income Correlation Chart
The statistical analysis conducted on geographies consisting of 281,258,630 people shows a mild negative correlation between the proportion of Panamanians and per capita income in the United States with a correlation coefficient (R) of -0.306 and weighted average of $42,035. Similarly, the statistical analysis conducted on geographies consisting of 218,088,473 people shows a significant negative correlation between the proportion of Immigrants from Kenya and per capita income in the United States with a correlation coefficient (R) of -0.606 and weighted average of $42,661, a difference of 1.5%.
Per Capita Income Correlation Summary
| Measurement | Panamanian | Immigrants from Kenya |
| Minimum | $15,844 | $12,576 |
| Maximum | $86,907 | $52,346 |
| Range | $71,063 | $39,770 |
| Mean | $39,085 | $36,572 |
| Median | $37,643 | $37,555 |
| Interquartile 25% (IQ1) | $29,415 | $34,356 |
| Interquartile 75% (IQ3) | $45,746 | $42,624 |
| Interquartile Range (IQR) | $16,331 | $8,268 |
| Standard Deviation (Sample) | $14,450 | $9,228 |
| Standard Deviation (Population) | $14,333 | $9,109 |
Demographics Similar to Panamanians and Immigrants from Kenya by Per Capita Income
In terms of per capita income, the demographic groups most similar to Panamanians are Venezuelan ($42,074, a difference of 0.090%), Immigrants from Sudan ($41,986, a difference of 0.12%), Ecuadorian ($41,958, a difference of 0.18%), Ghanaian ($42,164, a difference of 0.31%), and White/Caucasian ($42,180, a difference of 0.35%). Similarly, the demographic groups most similar to Immigrants from Kenya are Immigrants from Fiji ($42,694, a difference of 0.080%), Dutch ($42,605, a difference of 0.13%), Immigrants from Sierra Leone ($42,752, a difference of 0.21%), Iraqi ($42,760, a difference of 0.23%), and Scotch-Irish ($42,563, a difference of 0.23%).
| Demographics | Rating | Rank | Per Capita Income |
| Yugoslavians | 27.4 /100 | #191 | Fair $42,792 |
| Iraqis | 26.7 /100 | #192 | Fair $42,760 |
| Immigrants | Sierra Leone | 26.5 /100 | #193 | Fair $42,752 |
| Immigrants | Fiji | 25.2 /100 | #194 | Fair $42,694 |
| Immigrants | Kenya | 24.5 /100 | #195 | Fair $42,661 |
| Dutch | 23.4 /100 | #196 | Fair $42,605 |
| Scotch-Irish | 22.6 /100 | #197 | Fair $42,563 |
| Immigrants | Portugal | 19.7 /100 | #198 | Poor $42,412 |
| Barbadians | 19.6 /100 | #199 | Poor $42,406 |
| Vietnamese | 19.0 /100 | #200 | Poor $42,368 |
| Immigrants | Thailand | 17.6 /100 | #201 | Poor $42,289 |
| Immigrants | Bosnia and Herzegovina | 17.5 /100 | #202 | Poor $42,278 |
| Spanish | 17.0 /100 | #203 | Poor $42,249 |
| Aleuts | 16.4 /100 | #204 | Poor $42,210 |
| Whites/Caucasians | 15.9 /100 | #205 | Poor $42,180 |
| Ghanaians | 15.7 /100 | #206 | Poor $42,164 |
| Venezuelans | 14.4 /100 | #207 | Poor $42,074 |
| Panamanians | 13.9 /100 | #208 | Poor $42,035 |
| Immigrants | Sudan | 13.2 /100 | #209 | Poor $41,986 |
| Ecuadorians | 12.9 /100 | #210 | Poor $41,958 |
| Immigrants | Panama | 11.6 /100 | #211 | Poor $41,853 |