Potawatomi vs Immigrants from Kenya Disability Age Over 75
COMPARE
Potawatomi
Immigrants from Kenya
Disability Age Over 75
Disability Age Over 75 Comparison
Potawatomi
Immigrants from Kenya
49.0%
DISABILITY AGE OVER 75
0.2/ 100
METRIC RATING
270th/ 347
METRIC RANK
47.6%
DISABILITY AGE OVER 75
30.8/ 100
METRIC RATING
189th/ 347
METRIC RANK
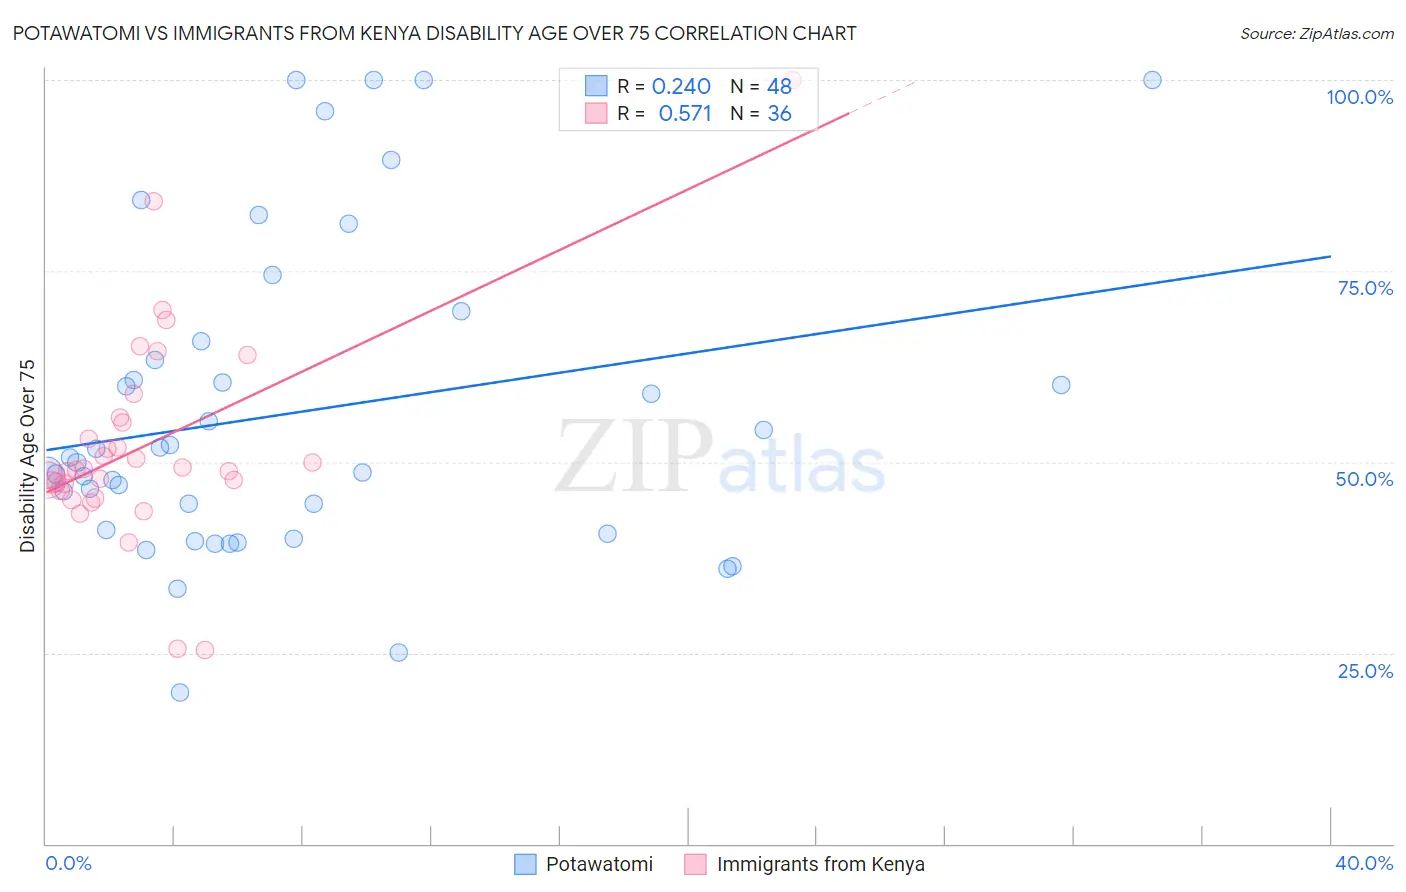
Potawatomi vs Immigrants from Kenya Disability Age Over 75 Correlation Chart
The statistical analysis conducted on geographies consisting of 117,704,790 people shows a weak positive correlation between the proportion of Potawatomi and percentage of population with a disability over the age of 75 in the United States with a correlation coefficient (R) of 0.240 and weighted average of 49.0%. Similarly, the statistical analysis conducted on geographies consisting of 217,778,670 people shows a substantial positive correlation between the proportion of Immigrants from Kenya and percentage of population with a disability over the age of 75 in the United States with a correlation coefficient (R) of 0.571 and weighted average of 47.6%, a difference of 3.1%.
Disability Age Over 75 Correlation Summary
| Measurement | Potawatomi | Immigrants from Kenya |
| Minimum | 19.8% | 25.4% |
| Maximum | 100.0% | 100.0% |
| Range | 80.2% | 74.6% |
| Mean | 56.5% | 52.3% |
| Median | 50.3% | 49.0% |
| Interquartile 25% (IQ1) | 40.8% | 46.7% |
| Interquartile 75% (IQ3) | 64.6% | 55.5% |
| Interquartile Range (IQR) | 23.8% | 8.8% |
| Standard Deviation (Sample) | 20.6% | 13.7% |
| Standard Deviation (Population) | 20.4% | 13.5% |
Similar Demographics by Disability Age Over 75
Demographics Similar to Potawatomi by Disability Age Over 75
In terms of disability age over 75, the demographic groups most similar to Potawatomi are Fijian (49.0%, a difference of 0.020%), Immigrants from El Salvador (49.0%, a difference of 0.030%), Assyrian/Chaldean/Syriac (49.1%, a difference of 0.030%), Guatemalan (49.0%, a difference of 0.050%), and Malaysian (49.0%, a difference of 0.060%).
| Demographics | Rating | Rank | Disability Age Over 75 |
| Salvadorans | 0.3 /100 | #263 | Tragic 48.9% |
| Immigrants | Honduras | 0.3 /100 | #264 | Tragic 48.9% |
| Hondurans | 0.3 /100 | #265 | Tragic 48.9% |
| U.S. Virgin Islanders | 0.2 /100 | #266 | Tragic 48.9% |
| Malaysians | 0.2 /100 | #267 | Tragic 49.0% |
| Guatemalans | 0.2 /100 | #268 | Tragic 49.0% |
| Immigrants | El Salvador | 0.2 /100 | #269 | Tragic 49.0% |
| Potawatomi | 0.2 /100 | #270 | Tragic 49.0% |
| Fijians | 0.2 /100 | #271 | Tragic 49.0% |
| Assyrians/Chaldeans/Syriacs | 0.2 /100 | #272 | Tragic 49.1% |
| Immigrants | Iraq | 0.1 /100 | #273 | Tragic 49.1% |
| Immigrants | Guatemala | 0.1 /100 | #274 | Tragic 49.1% |
| Immigrants | Dominica | 0.1 /100 | #275 | Tragic 49.1% |
| Immigrants | Uzbekistan | 0.1 /100 | #276 | Tragic 49.2% |
| Hawaiians | 0.1 /100 | #277 | Tragic 49.2% |
Demographics Similar to Immigrants from Kenya by Disability Age Over 75
In terms of disability age over 75, the demographic groups most similar to Immigrants from Kenya are Basque (47.6%, a difference of 0.0%), Immigrants from Sudan (47.5%, a difference of 0.020%), Sudanese (47.5%, a difference of 0.030%), Somali (47.6%, a difference of 0.040%), and Portuguese (47.6%, a difference of 0.040%).
| Demographics | Rating | Rank | Disability Age Over 75 |
| Immigrants | Moldova | 39.9 /100 | #182 | Fair 47.4% |
| Delaware | 39.1 /100 | #183 | Fair 47.5% |
| Immigrants | Nigeria | 34.0 /100 | #184 | Fair 47.5% |
| Ghanaians | 33.0 /100 | #185 | Fair 47.5% |
| Sudanese | 32.0 /100 | #186 | Fair 47.5% |
| Immigrants | Sudan | 31.8 /100 | #187 | Fair 47.5% |
| Basques | 30.9 /100 | #188 | Fair 47.6% |
| Immigrants | Kenya | 30.8 /100 | #189 | Fair 47.6% |
| Somalis | 29.5 /100 | #190 | Fair 47.6% |
| Portuguese | 29.3 /100 | #191 | Fair 47.6% |
| Immigrants | Jamaica | 28.3 /100 | #192 | Fair 47.6% |
| Ottawa | 28.1 /100 | #193 | Fair 47.6% |
| Immigrants | Lebanon | 26.5 /100 | #194 | Fair 47.6% |
| Immigrants | Trinidad and Tobago | 25.3 /100 | #195 | Fair 47.6% |
| Immigrants | Portugal | 23.8 /100 | #196 | Fair 47.6% |