Paiute vs Immigrants from Kenya Per Capita Income
COMPARE
Paiute
Immigrants from Kenya
Per Capita Income
Per Capita Income Comparison
Paiute
Immigrants from Kenya
$37,066
PER CAPITA INCOME
0.1/ 100
METRIC RATING
303rd/ 347
METRIC RANK
$42,661
PER CAPITA INCOME
24.5/ 100
METRIC RATING
195th/ 347
METRIC RANK
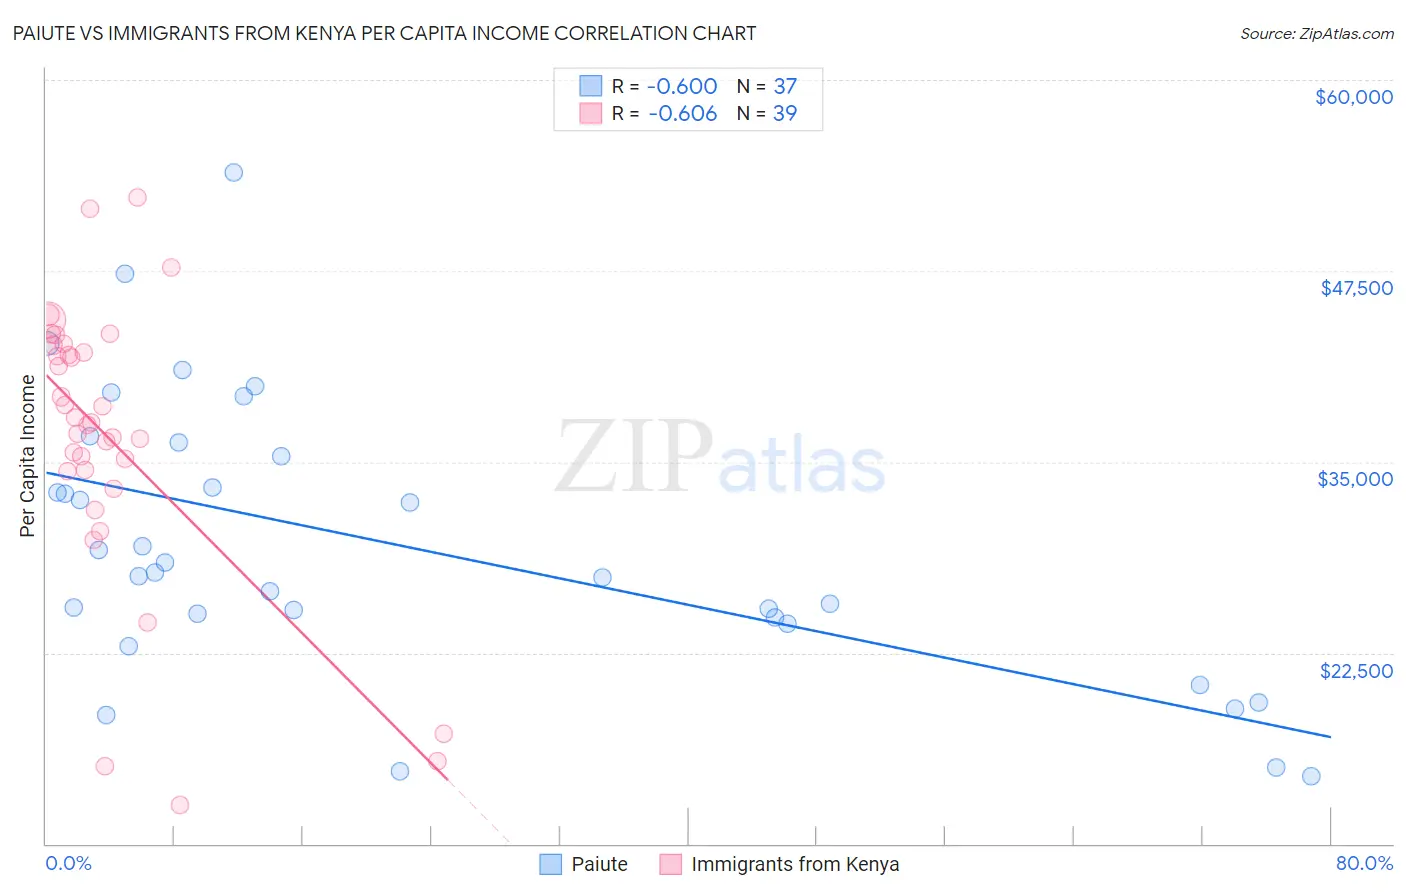
Paiute vs Immigrants from Kenya Per Capita Income Correlation Chart
The statistical analysis conducted on geographies consisting of 58,406,657 people shows a substantial negative correlation between the proportion of Paiute and per capita income in the United States with a correlation coefficient (R) of -0.600 and weighted average of $37,066. Similarly, the statistical analysis conducted on geographies consisting of 218,088,473 people shows a significant negative correlation between the proportion of Immigrants from Kenya and per capita income in the United States with a correlation coefficient (R) of -0.606 and weighted average of $42,661, a difference of 15.1%.
Per Capita Income Correlation Summary
| Measurement | Paiute | Immigrants from Kenya |
| Minimum | $14,446 | $12,576 |
| Maximum | $53,939 | $52,346 |
| Range | $39,493 | $39,770 |
| Mean | $29,535 | $36,572 |
| Median | $27,776 | $37,555 |
| Interquartile 25% (IQ1) | $24,580 | $34,356 |
| Interquartile 75% (IQ3) | $35,820 | $42,624 |
| Interquartile Range (IQR) | $11,240 | $8,268 |
| Standard Deviation (Sample) | $9,120 | $9,228 |
| Standard Deviation (Population) | $8,996 | $9,109 |
Similar Demographics by Per Capita Income
Demographics Similar to Paiute by Per Capita Income
In terms of per capita income, the demographic groups most similar to Paiute are Shoshone ($37,072, a difference of 0.020%), Honduran ($37,031, a difference of 0.090%), Ottawa ($37,101, a difference of 0.10%), Inupiat ($36,999, a difference of 0.18%), and Immigrants from Bahamas ($37,193, a difference of 0.34%).
| Demographics | Rating | Rank | Per Capita Income |
| Indonesians | 0.1 /100 | #296 | Tragic $37,300 |
| Haitians | 0.1 /100 | #297 | Tragic $37,289 |
| Immigrants | Caribbean | 0.1 /100 | #298 | Tragic $37,254 |
| Cherokee | 0.1 /100 | #299 | Tragic $37,203 |
| Immigrants | Bahamas | 0.1 /100 | #300 | Tragic $37,193 |
| Ottawa | 0.1 /100 | #301 | Tragic $37,101 |
| Shoshone | 0.1 /100 | #302 | Tragic $37,072 |
| Paiute | 0.1 /100 | #303 | Tragic $37,066 |
| Hondurans | 0.1 /100 | #304 | Tragic $37,031 |
| Inupiat | 0.1 /100 | #305 | Tragic $36,999 |
| Immigrants | Haiti | 0.0 /100 | #306 | Tragic $36,849 |
| Immigrants | Latin America | 0.0 /100 | #307 | Tragic $36,823 |
| Fijians | 0.0 /100 | #308 | Tragic $36,690 |
| Immigrants | Honduras | 0.0 /100 | #309 | Tragic $36,665 |
| Ute | 0.0 /100 | #310 | Tragic $36,651 |
Demographics Similar to Immigrants from Kenya by Per Capita Income
In terms of per capita income, the demographic groups most similar to Immigrants from Kenya are Immigrants from Fiji ($42,694, a difference of 0.080%), Dutch ($42,605, a difference of 0.13%), Immigrants from Sierra Leone ($42,752, a difference of 0.21%), Iraqi ($42,760, a difference of 0.23%), and Scotch-Irish ($42,563, a difference of 0.23%).
| Demographics | Rating | Rank | Per Capita Income |
| Immigrants | Africa | 31.0 /100 | #188 | Fair $42,950 |
| Bermudans | 30.1 /100 | #189 | Fair $42,911 |
| Kenyans | 27.7 /100 | #190 | Fair $42,808 |
| Yugoslavians | 27.4 /100 | #191 | Fair $42,792 |
| Iraqis | 26.7 /100 | #192 | Fair $42,760 |
| Immigrants | Sierra Leone | 26.5 /100 | #193 | Fair $42,752 |
| Immigrants | Fiji | 25.2 /100 | #194 | Fair $42,694 |
| Immigrants | Kenya | 24.5 /100 | #195 | Fair $42,661 |
| Dutch | 23.4 /100 | #196 | Fair $42,605 |
| Scotch-Irish | 22.6 /100 | #197 | Fair $42,563 |
| Immigrants | Portugal | 19.7 /100 | #198 | Poor $42,412 |
| Barbadians | 19.6 /100 | #199 | Poor $42,406 |
| Vietnamese | 19.0 /100 | #200 | Poor $42,368 |
| Immigrants | Thailand | 17.6 /100 | #201 | Poor $42,289 |
| Immigrants | Bosnia and Herzegovina | 17.5 /100 | #202 | Poor $42,278 |