Italian vs Immigrants from Albania Per Capita Income
COMPARE
Italian
Immigrants from Albania
Per Capita Income
Per Capita Income Comparison
Italians
Immigrants from Albania
$47,574
PER CAPITA INCOME
98.8/ 100
METRIC RATING
90th/ 347
METRIC RANK
$46,387
PER CAPITA INCOME
95.5/ 100
METRIC RATING
113th/ 347
METRIC RANK
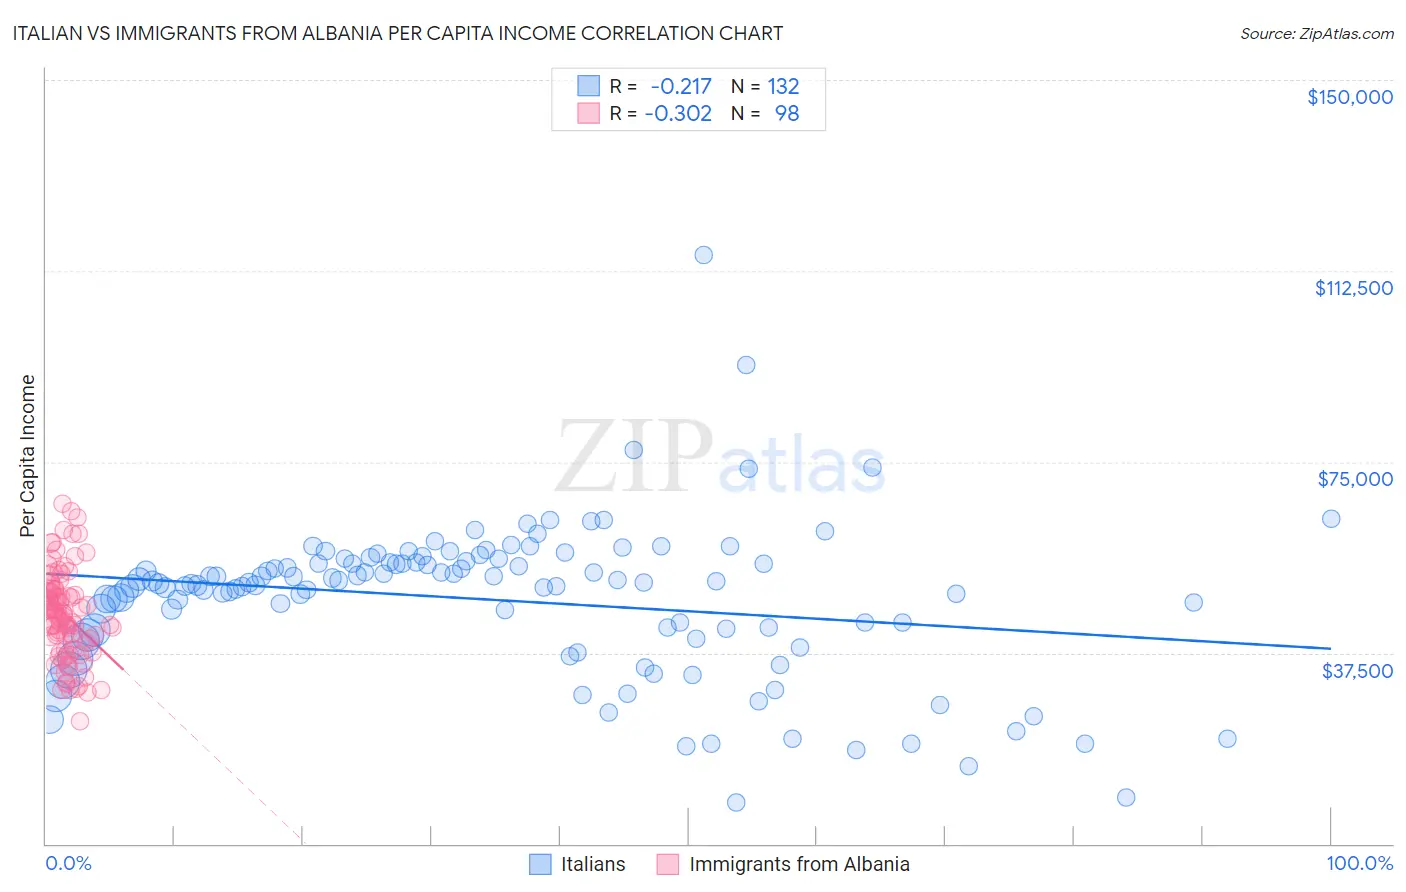
Italian vs Immigrants from Albania Per Capita Income Correlation Chart
The statistical analysis conducted on geographies consisting of 575,176,397 people shows a weak negative correlation between the proportion of Italians and per capita income in the United States with a correlation coefficient (R) of -0.217 and weighted average of $47,574. Similarly, the statistical analysis conducted on geographies consisting of 119,376,608 people shows a mild negative correlation between the proportion of Immigrants from Albania and per capita income in the United States with a correlation coefficient (R) of -0.302 and weighted average of $46,387, a difference of 2.6%.
Per Capita Income Correlation Summary
| Measurement | Italian | Immigrants from Albania |
| Minimum | $7,984 | $24,123 |
| Maximum | $115,662 | $66,738 |
| Range | $107,678 | $42,615 |
| Mean | $47,928 | $45,029 |
| Median | $51,120 | $45,153 |
| Interquartile 25% (IQ1) | $41,399 | $39,496 |
| Interquartile 75% (IQ3) | $55,329 | $49,916 |
| Interquartile Range (IQR) | $13,930 | $10,420 |
| Standard Deviation (Sample) | $15,071 | $8,753 |
| Standard Deviation (Population) | $15,014 | $8,708 |
Similar Demographics by Per Capita Income
Demographics Similar to Italians by Per Capita Income
In terms of per capita income, the demographic groups most similar to Italians are Macedonian ($47,573, a difference of 0.0%), Immigrants from Moldova ($47,489, a difference of 0.18%), Northern European ($47,698, a difference of 0.26%), Croatian ($47,742, a difference of 0.35%), and Immigrants from Zimbabwe ($47,394, a difference of 0.38%).
| Demographics | Rating | Rank | Per Capita Income |
| Immigrants | Brazil | 99.4 /100 | #83 | Exceptional $48,164 |
| Immigrants | Ukraine | 99.3 /100 | #84 | Exceptional $48,134 |
| Austrians | 99.3 /100 | #85 | Exceptional $48,116 |
| Immigrants | Southern Europe | 99.3 /100 | #86 | Exceptional $48,027 |
| Ukrainians | 99.3 /100 | #87 | Exceptional $48,014 |
| Croatians | 99.0 /100 | #88 | Exceptional $47,742 |
| Northern Europeans | 98.9 /100 | #89 | Exceptional $47,698 |
| Italians | 98.8 /100 | #90 | Exceptional $47,574 |
| Macedonians | 98.8 /100 | #91 | Exceptional $47,573 |
| Immigrants | Moldova | 98.7 /100 | #92 | Exceptional $47,489 |
| Immigrants | Zimbabwe | 98.5 /100 | #93 | Exceptional $47,394 |
| Albanians | 98.5 /100 | #94 | Exceptional $47,379 |
| Immigrants | Egypt | 98.5 /100 | #95 | Exceptional $47,361 |
| Alsatians | 98.3 /100 | #96 | Exceptional $47,284 |
| Carpatho Rusyns | 98.2 /100 | #97 | Exceptional $47,248 |
Demographics Similar to Immigrants from Albania by Per Capita Income
In terms of per capita income, the demographic groups most similar to Immigrants from Albania are Immigrants from Morocco ($46,430, a difference of 0.090%), Taiwanese ($46,455, a difference of 0.14%), Chilean ($46,459, a difference of 0.15%), Afghan ($46,268, a difference of 0.26%), and Immigrants from Northern Africa ($46,531, a difference of 0.31%).
| Demographics | Rating | Rank | Per Capita Income |
| Ethiopians | 96.3 /100 | #106 | Exceptional $46,569 |
| Serbians | 96.2 /100 | #107 | Exceptional $46,551 |
| Immigrants | Kuwait | 96.2 /100 | #108 | Exceptional $46,543 |
| Immigrants | Northern Africa | 96.2 /100 | #109 | Exceptional $46,531 |
| Chileans | 95.9 /100 | #110 | Exceptional $46,459 |
| Taiwanese | 95.8 /100 | #111 | Exceptional $46,455 |
| Immigrants | Morocco | 95.7 /100 | #112 | Exceptional $46,430 |
| Immigrants | Albania | 95.5 /100 | #113 | Exceptional $46,387 |
| Afghans | 94.9 /100 | #114 | Exceptional $46,268 |
| Immigrants | Chile | 94.6 /100 | #115 | Exceptional $46,213 |
| Poles | 94.1 /100 | #116 | Exceptional $46,123 |
| Chinese | 93.9 /100 | #117 | Exceptional $46,098 |
| Immigrants | Saudi Arabia | 93.3 /100 | #118 | Exceptional $46,008 |
| Immigrants | Poland | 93.1 /100 | #119 | Exceptional $45,979 |
| Immigrants | Ethiopia | 92.7 /100 | #120 | Exceptional $45,923 |