Potawatomi vs Immigrants from Albania In Labor Force | Age 16-19
COMPARE
Potawatomi
Immigrants from Albania
In Labor Force | Age 16-19
In Labor Force | Age 16-19 Comparison
Potawatomi
Immigrants from Albania
40.0%
IN LABOR FORCE | AGE 16-19
99.9/ 100
METRIC RATING
69th/ 347
METRIC RANK
35.8%
IN LABOR FORCE | AGE 16-19
15.0/ 100
METRIC RATING
204th/ 347
METRIC RANK
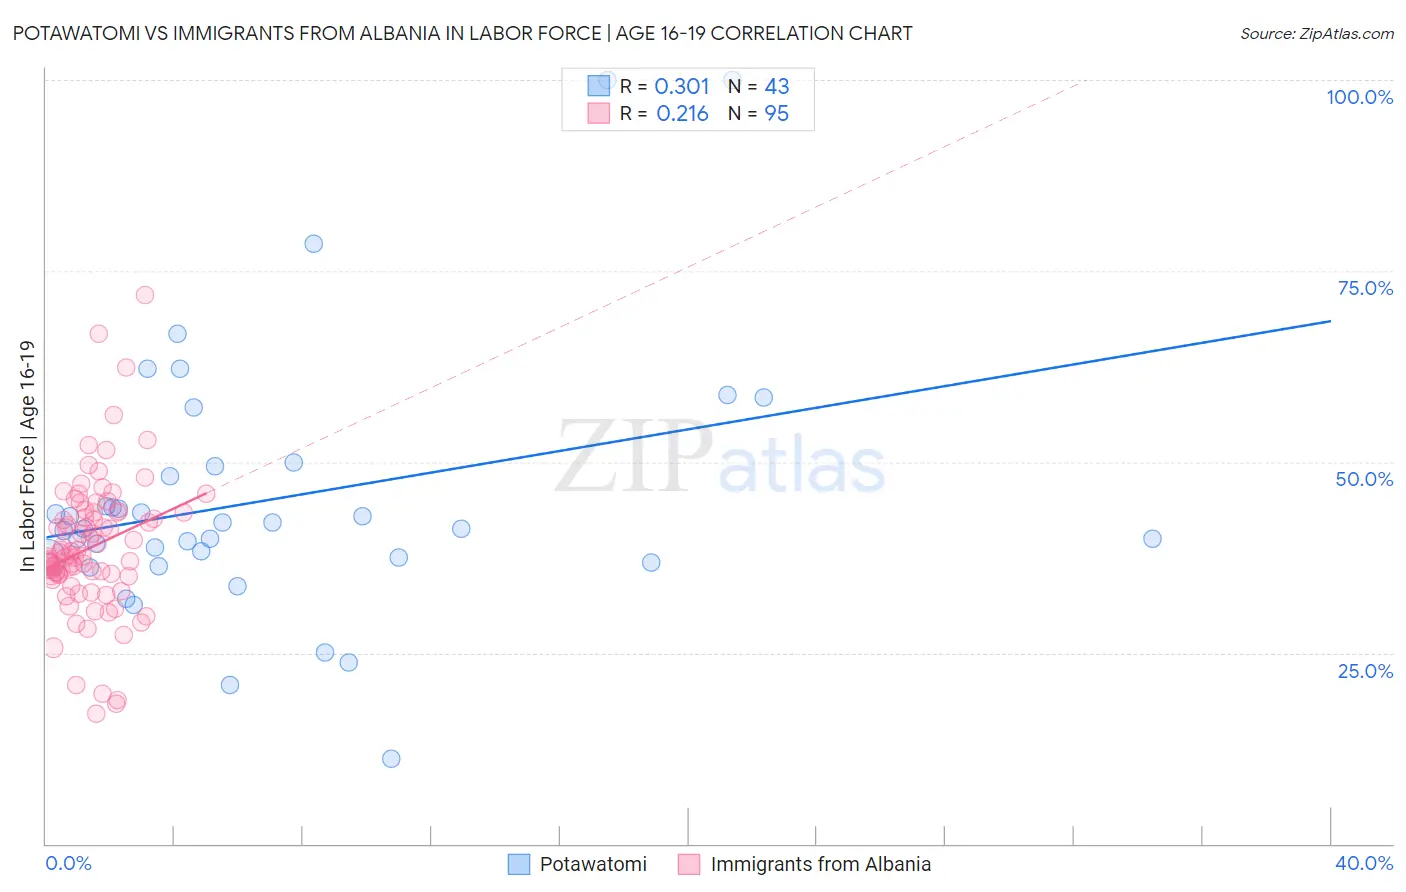
Potawatomi vs Immigrants from Albania In Labor Force | Age 16-19 Correlation Chart
The statistical analysis conducted on geographies consisting of 117,698,068 people shows a mild positive correlation between the proportion of Potawatomi and labor force participation rate among population between the ages 16 and 19 in the United States with a correlation coefficient (R) of 0.301 and weighted average of 40.0%. Similarly, the statistical analysis conducted on geographies consisting of 119,330,257 people shows a weak positive correlation between the proportion of Immigrants from Albania and labor force participation rate among population between the ages 16 and 19 in the United States with a correlation coefficient (R) of 0.216 and weighted average of 35.8%, a difference of 11.9%.
In Labor Force | Age 16-19 Correlation Summary
| Measurement | Potawatomi | Immigrants from Albania |
| Minimum | 11.1% | 17.1% |
| Maximum | 100.0% | 71.9% |
| Range | 88.9% | 54.8% |
| Mean | 45.1% | 38.8% |
| Median | 41.3% | 37.7% |
| Interquartile 25% (IQ1) | 37.4% | 35.1% |
| Interquartile 75% (IQ3) | 49.5% | 43.4% |
| Interquartile Range (IQR) | 12.1% | 8.3% |
| Standard Deviation (Sample) | 17.3% | 9.0% |
| Standard Deviation (Population) | 17.1% | 9.0% |
Similar Demographics by In Labor Force | Age 16-19
Demographics Similar to Potawatomi by In Labor Force | Age 16-19
In terms of in labor force | age 16-19, the demographic groups most similar to Potawatomi are Portuguese (40.0%, a difference of 0.050%), Italian (40.1%, a difference of 0.070%), Canadian (40.1%, a difference of 0.13%), Nonimmigrants (40.1%, a difference of 0.14%), and Serbian (39.9%, a difference of 0.22%).
| Demographics | Rating | Rank | In Labor Force | Age 16-19 |
| Cherokee | 100.0 /100 | #62 | Exceptional 40.2% |
| Northern Europeans | 100.0 /100 | #63 | Exceptional 40.2% |
| Immigrants | Micronesia | 100.0 /100 | #64 | Exceptional 40.2% |
| Kenyans | 100.0 /100 | #65 | Exceptional 40.1% |
| Immigrants | Nonimmigrants | 100.0 /100 | #66 | Exceptional 40.1% |
| Canadians | 100.0 /100 | #67 | Exceptional 40.1% |
| Italians | 99.9 /100 | #68 | Exceptional 40.1% |
| Potawatomi | 99.9 /100 | #69 | Exceptional 40.0% |
| Portuguese | 99.9 /100 | #70 | Exceptional 40.0% |
| Serbians | 99.9 /100 | #71 | Exceptional 39.9% |
| Iroquois | 99.9 /100 | #72 | Exceptional 39.9% |
| Immigrants | Middle Africa | 99.9 /100 | #73 | Exceptional 39.9% |
| Hungarians | 99.9 /100 | #74 | Exceptional 39.8% |
| French American Indians | 99.9 /100 | #75 | Exceptional 39.8% |
| Malaysians | 99.9 /100 | #76 | Exceptional 39.7% |
Demographics Similar to Immigrants from Albania by In Labor Force | Age 16-19
In terms of in labor force | age 16-19, the demographic groups most similar to Immigrants from Albania are South American Indian (35.8%, a difference of 0.040%), Chilean (35.8%, a difference of 0.040%), Immigrants from Eastern Europe (35.8%, a difference of 0.050%), Immigrants from Nigeria (35.8%, a difference of 0.17%), and Korean (35.7%, a difference of 0.17%).
| Demographics | Rating | Rank | In Labor Force | Age 16-19 |
| Immigrants | Serbia | 21.0 /100 | #197 | Fair 36.0% |
| Immigrants | Northern Africa | 19.9 /100 | #198 | Poor 35.9% |
| Immigrants | Norway | 19.8 /100 | #199 | Poor 35.9% |
| Immigrants | Sweden | 18.8 /100 | #200 | Poor 35.9% |
| Alsatians | 17.5 /100 | #201 | Poor 35.9% |
| Senegalese | 17.4 /100 | #202 | Poor 35.9% |
| Immigrants | Nigeria | 16.8 /100 | #203 | Poor 35.8% |
| Immigrants | Albania | 15.0 /100 | #204 | Poor 35.8% |
| South American Indians | 14.6 /100 | #205 | Poor 35.8% |
| Chileans | 14.6 /100 | #206 | Poor 35.8% |
| Immigrants | Eastern Europe | 14.5 /100 | #207 | Poor 35.8% |
| Koreans | 13.3 /100 | #208 | Poor 35.7% |
| Moroccans | 12.7 /100 | #209 | Poor 35.7% |
| Immigrants | Switzerland | 11.9 /100 | #210 | Poor 35.6% |
| Mexicans | 11.9 /100 | #211 | Poor 35.6% |