Somali vs Immigrants from Albania Per Capita Income
COMPARE
Somali
Immigrants from Albania
Per Capita Income
Per Capita Income Comparison
Somalis
Immigrants from Albania
$40,367
PER CAPITA INCOME
2.4/ 100
METRIC RATING
238th/ 347
METRIC RANK
$46,387
PER CAPITA INCOME
95.5/ 100
METRIC RATING
113th/ 347
METRIC RANK
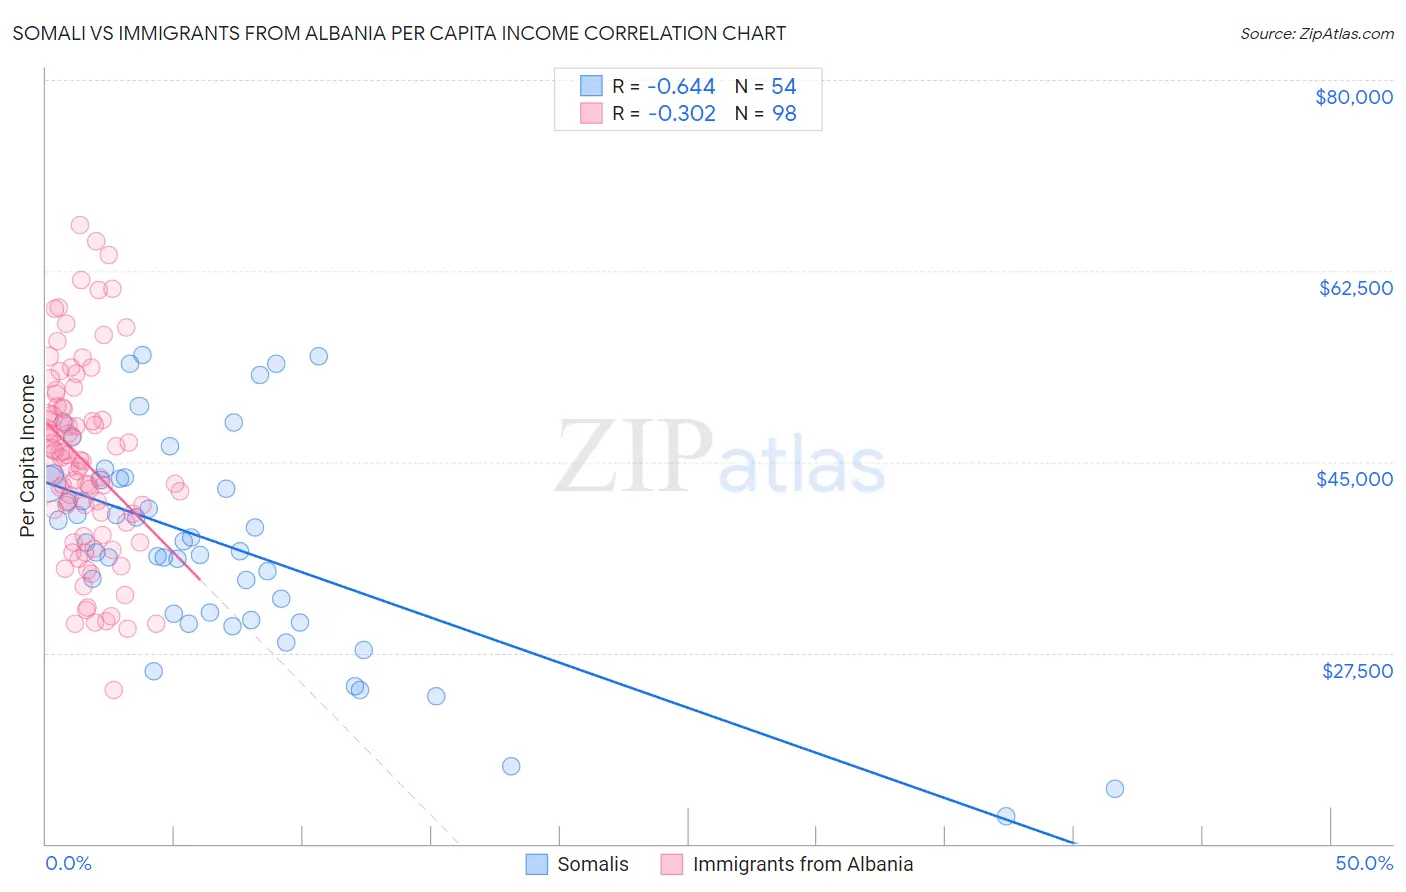
Somali vs Immigrants from Albania Per Capita Income Correlation Chart
The statistical analysis conducted on geographies consisting of 99,334,522 people shows a significant negative correlation between the proportion of Somalis and per capita income in the United States with a correlation coefficient (R) of -0.644 and weighted average of $40,367. Similarly, the statistical analysis conducted on geographies consisting of 119,376,608 people shows a mild negative correlation between the proportion of Immigrants from Albania and per capita income in the United States with a correlation coefficient (R) of -0.302 and weighted average of $46,387, a difference of 14.9%.
Per Capita Income Correlation Summary
| Measurement | Somali | Immigrants from Albania |
| Minimum | $12,576 | $24,123 |
| Maximum | $54,740 | $66,738 |
| Range | $42,164 | $42,615 |
| Mean | $37,481 | $45,029 |
| Median | $37,654 | $45,153 |
| Interquartile 25% (IQ1) | $31,050 | $39,496 |
| Interquartile 75% (IQ3) | $43,455 | $49,916 |
| Interquartile Range (IQR) | $12,404 | $10,420 |
| Standard Deviation (Sample) | $9,737 | $8,753 |
| Standard Deviation (Population) | $9,647 | $8,708 |
Similar Demographics by Per Capita Income
Demographics Similar to Somalis by Per Capita Income
In terms of per capita income, the demographic groups most similar to Somalis are Tsimshian ($40,344, a difference of 0.060%), Immigrants from Nigeria ($40,339, a difference of 0.070%), British West Indian ($40,330, a difference of 0.090%), Immigrants from Cambodia ($40,434, a difference of 0.16%), and Immigrants from Western Africa ($40,294, a difference of 0.18%).
| Demographics | Rating | Rank | Per Capita Income |
| Senegalese | 4.8 /100 | #231 | Tragic $41,000 |
| Guyanese | 4.5 /100 | #232 | Tragic $40,949 |
| Delaware | 3.8 /100 | #233 | Tragic $40,778 |
| Immigrants | West Indies | 3.7 /100 | #234 | Tragic $40,763 |
| Immigrants | Guyana | 3.6 /100 | #235 | Tragic $40,742 |
| Immigrants | Nonimmigrants | 3.4 /100 | #236 | Tragic $40,669 |
| Immigrants | Cambodia | 2.6 /100 | #237 | Tragic $40,434 |
| Somalis | 2.4 /100 | #238 | Tragic $40,367 |
| Tsimshian | 2.4 /100 | #239 | Tragic $40,344 |
| Immigrants | Nigeria | 2.3 /100 | #240 | Tragic $40,339 |
| British West Indians | 2.3 /100 | #241 | Tragic $40,330 |
| Immigrants | Western Africa | 2.2 /100 | #242 | Tragic $40,294 |
| German Russians | 2.2 /100 | #243 | Tragic $40,266 |
| French American Indians | 2.1 /100 | #244 | Tragic $40,244 |
| Sub-Saharan Africans | 1.9 /100 | #245 | Tragic $40,152 |
Demographics Similar to Immigrants from Albania by Per Capita Income
In terms of per capita income, the demographic groups most similar to Immigrants from Albania are Immigrants from Morocco ($46,430, a difference of 0.090%), Taiwanese ($46,455, a difference of 0.14%), Chilean ($46,459, a difference of 0.15%), Afghan ($46,268, a difference of 0.26%), and Immigrants from Northern Africa ($46,531, a difference of 0.31%).
| Demographics | Rating | Rank | Per Capita Income |
| Ethiopians | 96.3 /100 | #106 | Exceptional $46,569 |
| Serbians | 96.2 /100 | #107 | Exceptional $46,551 |
| Immigrants | Kuwait | 96.2 /100 | #108 | Exceptional $46,543 |
| Immigrants | Northern Africa | 96.2 /100 | #109 | Exceptional $46,531 |
| Chileans | 95.9 /100 | #110 | Exceptional $46,459 |
| Taiwanese | 95.8 /100 | #111 | Exceptional $46,455 |
| Immigrants | Morocco | 95.7 /100 | #112 | Exceptional $46,430 |
| Immigrants | Albania | 95.5 /100 | #113 | Exceptional $46,387 |
| Afghans | 94.9 /100 | #114 | Exceptional $46,268 |
| Immigrants | Chile | 94.6 /100 | #115 | Exceptional $46,213 |
| Poles | 94.1 /100 | #116 | Exceptional $46,123 |
| Chinese | 93.9 /100 | #117 | Exceptional $46,098 |
| Immigrants | Saudi Arabia | 93.3 /100 | #118 | Exceptional $46,008 |
| Immigrants | Poland | 93.1 /100 | #119 | Exceptional $45,979 |
| Immigrants | Ethiopia | 92.7 /100 | #120 | Exceptional $45,923 |