Subsaharan African vs German Median Male Earnings
COMPARE
Subsaharan African
German
Median Male Earnings
Median Male Earnings Comparison
Sub-Saharan Africans
Germans
$50,408
MEDIAN MALE EARNINGS
1.8/ 100
METRIC RATING
247th/ 347
METRIC RANK
$54,974
MEDIAN MALE EARNINGS
61.6/ 100
METRIC RATING
166th/ 347
METRIC RANK
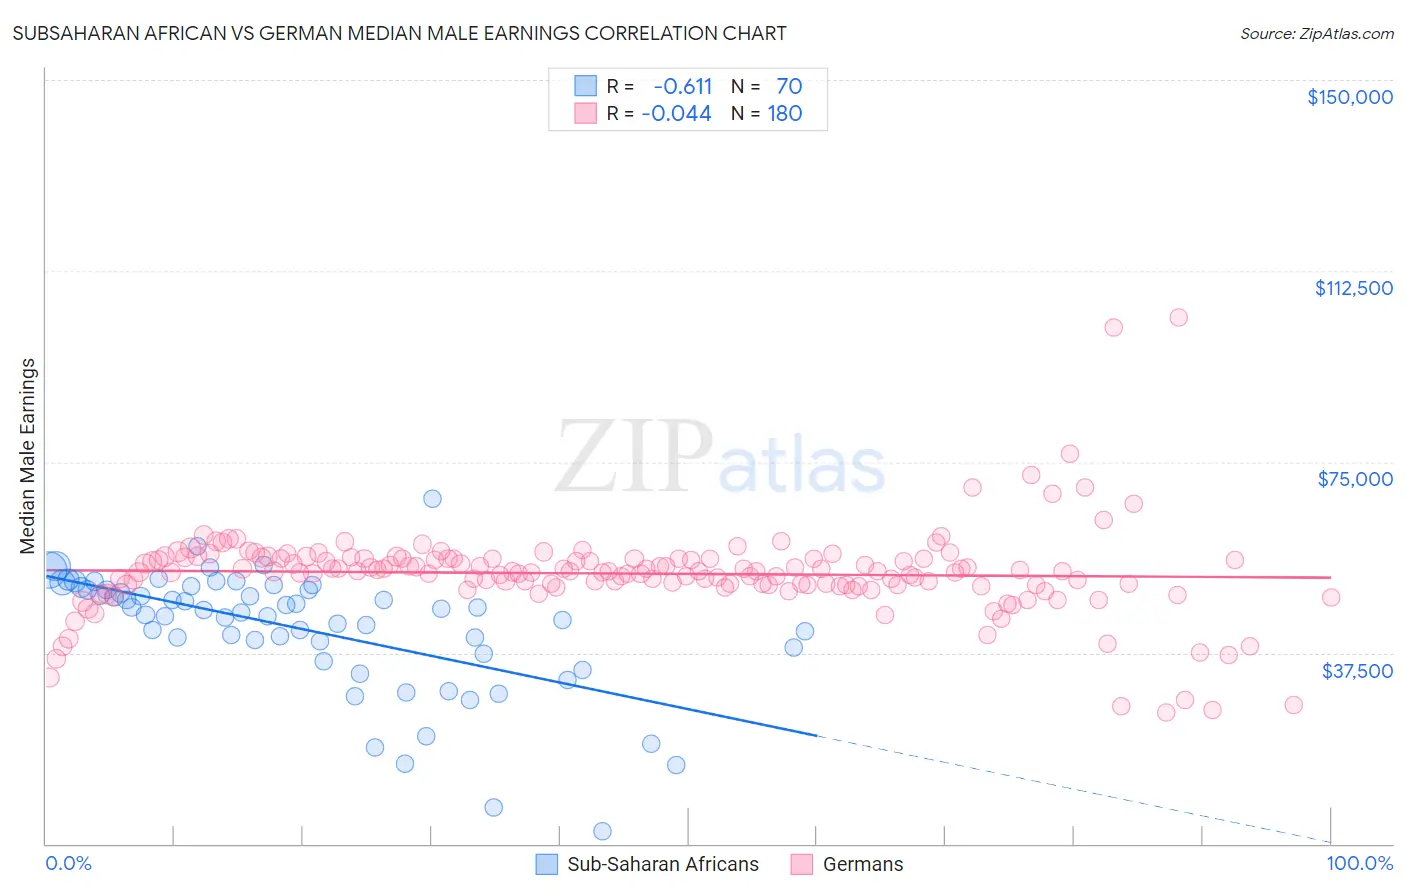
Subsaharan African vs German Median Male Earnings Correlation Chart
The statistical analysis conducted on geographies consisting of 507,818,984 people shows a significant negative correlation between the proportion of Sub-Saharan Africans and median male earnings in the United States with a correlation coefficient (R) of -0.611 and weighted average of $50,408. Similarly, the statistical analysis conducted on geographies consisting of 579,097,396 people shows no correlation between the proportion of Germans and median male earnings in the United States with a correlation coefficient (R) of -0.044 and weighted average of $54,974, a difference of 9.1%.
Median Male Earnings Correlation Summary
| Measurement | Subsaharan African | German |
| Minimum | $2,499 | $25,882 |
| Maximum | $67,727 | $103,432 |
| Range | $65,228 | $77,550 |
| Mean | $42,175 | $53,076 |
| Median | $45,761 | $53,458 |
| Interquartile 25% (IQ1) | $38,471 | $50,831 |
| Interquartile 75% (IQ3) | $49,902 | $56,007 |
| Interquartile Range (IQR) | $11,431 | $5,176 |
| Standard Deviation (Sample) | $12,034 | $8,925 |
| Standard Deviation (Population) | $11,948 | $8,900 |
Similar Demographics by Median Male Earnings
Demographics Similar to Sub-Saharan Africans by Median Male Earnings
In terms of median male earnings, the demographic groups most similar to Sub-Saharan Africans are Immigrants from Ecuador ($50,474, a difference of 0.13%), Hawaiian ($50,488, a difference of 0.16%), Immigrants from Guyana ($50,321, a difference of 0.17%), Immigrants from Burma/Myanmar ($50,298, a difference of 0.22%), and Osage ($50,292, a difference of 0.23%).
| Demographics | Rating | Rank | Median Male Earnings |
| West Indians | 2.3 /100 | #240 | Tragic $50,682 |
| Immigrants | St. Vincent and the Grenadines | 2.3 /100 | #241 | Tragic $50,665 |
| Guyanese | 2.2 /100 | #242 | Tragic $50,613 |
| French American Indians | 2.2 /100 | #243 | Tragic $50,611 |
| Houma | 2.0 /100 | #244 | Tragic $50,547 |
| Hawaiians | 1.9 /100 | #245 | Tragic $50,488 |
| Immigrants | Ecuador | 1.9 /100 | #246 | Tragic $50,474 |
| Sub-Saharan Africans | 1.8 /100 | #247 | Tragic $50,408 |
| Immigrants | Guyana | 1.6 /100 | #248 | Tragic $50,321 |
| Immigrants | Burma/Myanmar | 1.6 /100 | #249 | Tragic $50,298 |
| Osage | 1.6 /100 | #250 | Tragic $50,292 |
| Immigrants | Grenada | 1.6 /100 | #251 | Tragic $50,279 |
| Immigrants | Cabo Verde | 1.2 /100 | #252 | Tragic $50,009 |
| German Russians | 1.1 /100 | #253 | Tragic $49,924 |
| Senegalese | 1.0 /100 | #254 | Tragic $49,774 |
Demographics Similar to Germans by Median Male Earnings
In terms of median male earnings, the demographic groups most similar to Germans are Immigrants from Fiji ($54,958, a difference of 0.030%), Immigrants from Vietnam ($54,913, a difference of 0.11%), Immigrants from Portugal ($55,182, a difference of 0.38%), French Canadian ($54,722, a difference of 0.46%), and Finnish ($54,721, a difference of 0.46%).
| Demographics | Rating | Rank | Median Male Earnings |
| Alsatians | 70.5 /100 | #159 | Good $55,380 |
| Basques | 70.3 /100 | #160 | Good $55,370 |
| Belgians | 70.1 /100 | #161 | Good $55,361 |
| French | 69.9 /100 | #162 | Good $55,350 |
| Ugandans | 68.6 /100 | #163 | Good $55,290 |
| Immigrants | South Eastern Asia | 67.6 /100 | #164 | Good $55,241 |
| Immigrants | Portugal | 66.3 /100 | #165 | Good $55,182 |
| Germans | 61.6 /100 | #166 | Good $54,974 |
| Immigrants | Fiji | 61.2 /100 | #167 | Good $54,958 |
| Immigrants | Vietnam | 60.2 /100 | #168 | Good $54,913 |
| French Canadians | 55.6 /100 | #169 | Average $54,722 |
| Finns | 55.6 /100 | #170 | Average $54,721 |
| Immigrants | Peru | 54.9 /100 | #171 | Average $54,695 |
| Welsh | 53.8 /100 | #172 | Average $54,647 |
| South American Indians | 50.4 /100 | #173 | Average $54,508 |