Cypriot vs German Median Male Earnings
COMPARE
Cypriot
German
Median Male Earnings
Median Male Earnings Comparison
Cypriots
Germans
$65,549
MEDIAN MALE EARNINGS
100.0/ 100
METRIC RATING
19th/ 347
METRIC RANK
$54,974
MEDIAN MALE EARNINGS
61.6/ 100
METRIC RATING
166th/ 347
METRIC RANK
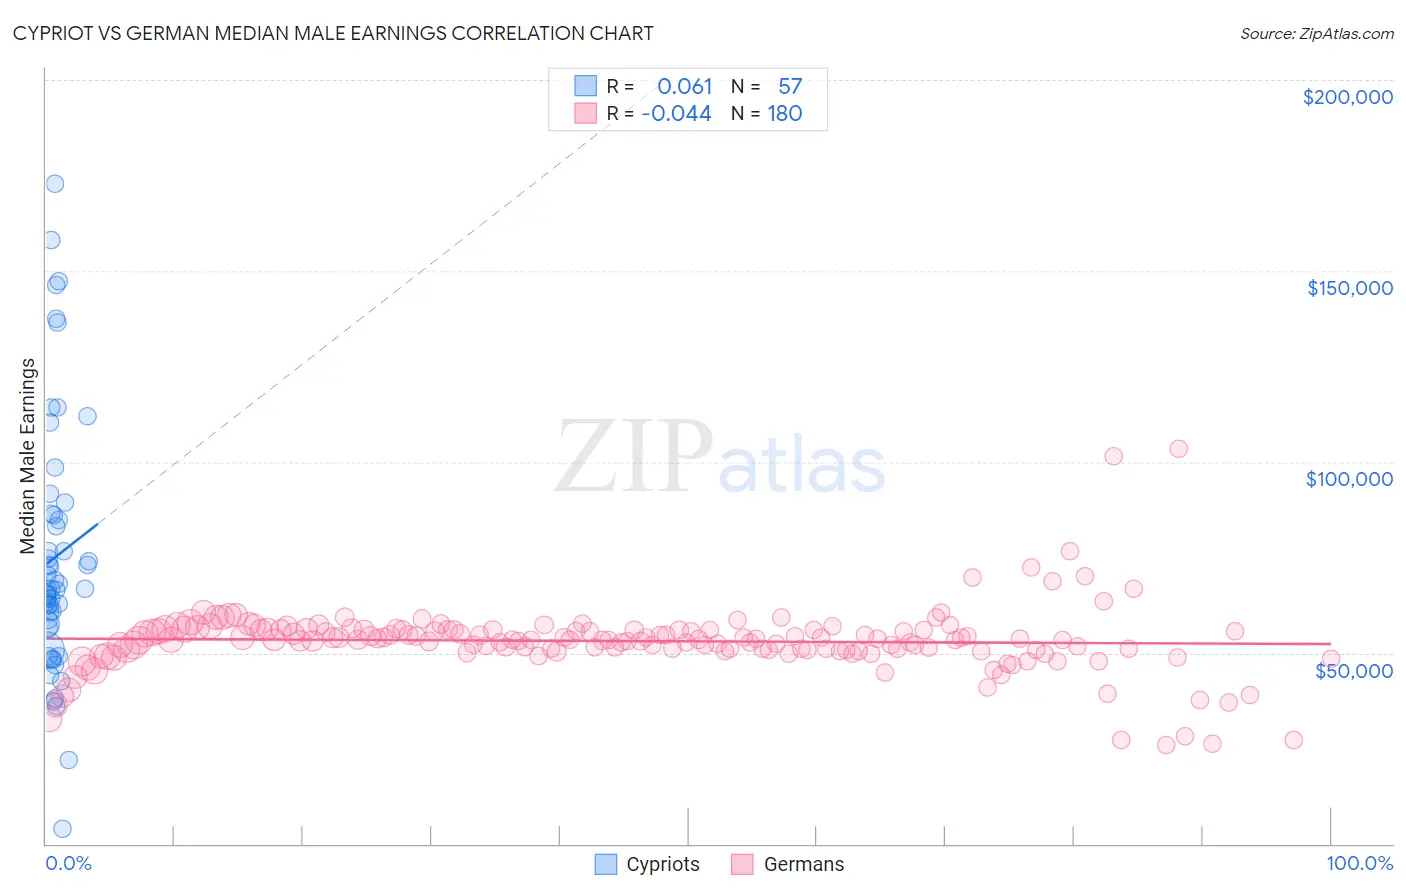
Cypriot vs German Median Male Earnings Correlation Chart
The statistical analysis conducted on geographies consisting of 61,867,128 people shows a slight positive correlation between the proportion of Cypriots and median male earnings in the United States with a correlation coefficient (R) of 0.061 and weighted average of $65,549. Similarly, the statistical analysis conducted on geographies consisting of 579,097,396 people shows no correlation between the proportion of Germans and median male earnings in the United States with a correlation coefficient (R) of -0.044 and weighted average of $54,974, a difference of 19.2%.
Median Male Earnings Correlation Summary
| Measurement | Cypriot | German |
| Minimum | $3,864 | $25,882 |
| Maximum | $172,778 | $103,432 |
| Range | $168,914 | $77,550 |
| Mean | $75,157 | $53,076 |
| Median | $66,784 | $53,458 |
| Interquartile 25% (IQ1) | $56,985 | $50,831 |
| Interquartile 75% (IQ3) | $86,286 | $56,007 |
| Interquartile Range (IQR) | $29,301 | $5,176 |
| Standard Deviation (Sample) | $33,466 | $8,925 |
| Standard Deviation (Population) | $33,171 | $8,900 |
Similar Demographics by Median Male Earnings
Demographics Similar to Cypriots by Median Male Earnings
In terms of median male earnings, the demographic groups most similar to Cypriots are Immigrants from Japan ($65,518, a difference of 0.050%), Immigrants from Sweden ($65,406, a difference of 0.22%), Burmese ($65,236, a difference of 0.48%), Immigrants from Korea ($65,079, a difference of 0.72%), and Indian (Asian) ($66,078, a difference of 0.81%).
| Demographics | Rating | Rank | Median Male Earnings |
| Immigrants | Australia | 100.0 /100 | #12 | Exceptional $67,634 |
| Immigrants | China | 100.0 /100 | #13 | Exceptional $67,353 |
| Okinawans | 100.0 /100 | #14 | Exceptional $67,232 |
| Immigrants | Eastern Asia | 100.0 /100 | #15 | Exceptional $66,903 |
| Eastern Europeans | 100.0 /100 | #16 | Exceptional $66,472 |
| Immigrants | Belgium | 100.0 /100 | #17 | Exceptional $66,125 |
| Indians (Asian) | 100.0 /100 | #18 | Exceptional $66,078 |
| Cypriots | 100.0 /100 | #19 | Exceptional $65,549 |
| Immigrants | Japan | 100.0 /100 | #20 | Exceptional $65,518 |
| Immigrants | Sweden | 100.0 /100 | #21 | Exceptional $65,406 |
| Burmese | 100.0 /100 | #22 | Exceptional $65,236 |
| Immigrants | Korea | 100.0 /100 | #23 | Exceptional $65,079 |
| Immigrants | Northern Europe | 100.0 /100 | #24 | Exceptional $64,987 |
| Immigrants | Denmark | 100.0 /100 | #25 | Exceptional $64,625 |
| Turks | 100.0 /100 | #26 | Exceptional $64,253 |
Demographics Similar to Germans by Median Male Earnings
In terms of median male earnings, the demographic groups most similar to Germans are Immigrants from Fiji ($54,958, a difference of 0.030%), Immigrants from Vietnam ($54,913, a difference of 0.11%), Immigrants from Portugal ($55,182, a difference of 0.38%), French Canadian ($54,722, a difference of 0.46%), and Finnish ($54,721, a difference of 0.46%).
| Demographics | Rating | Rank | Median Male Earnings |
| Alsatians | 70.5 /100 | #159 | Good $55,380 |
| Basques | 70.3 /100 | #160 | Good $55,370 |
| Belgians | 70.1 /100 | #161 | Good $55,361 |
| French | 69.9 /100 | #162 | Good $55,350 |
| Ugandans | 68.6 /100 | #163 | Good $55,290 |
| Immigrants | South Eastern Asia | 67.6 /100 | #164 | Good $55,241 |
| Immigrants | Portugal | 66.3 /100 | #165 | Good $55,182 |
| Germans | 61.6 /100 | #166 | Good $54,974 |
| Immigrants | Fiji | 61.2 /100 | #167 | Good $54,958 |
| Immigrants | Vietnam | 60.2 /100 | #168 | Good $54,913 |
| French Canadians | 55.6 /100 | #169 | Average $54,722 |
| Finns | 55.6 /100 | #170 | Average $54,721 |
| Immigrants | Peru | 54.9 /100 | #171 | Average $54,695 |
| Welsh | 53.8 /100 | #172 | Average $54,647 |
| South American Indians | 50.4 /100 | #173 | Average $54,508 |