Polish vs Indonesian 3rd Grade
COMPARE
Polish
Indonesian
3rd Grade
3rd Grade Comparison
Poles
Indonesians
98.5%
3RD GRADE
100.0/ 100
METRIC RATING
19th/ 347
METRIC RANK
96.5%
3RD GRADE
0.0/ 100
METRIC RATING
321st/ 347
METRIC RANK
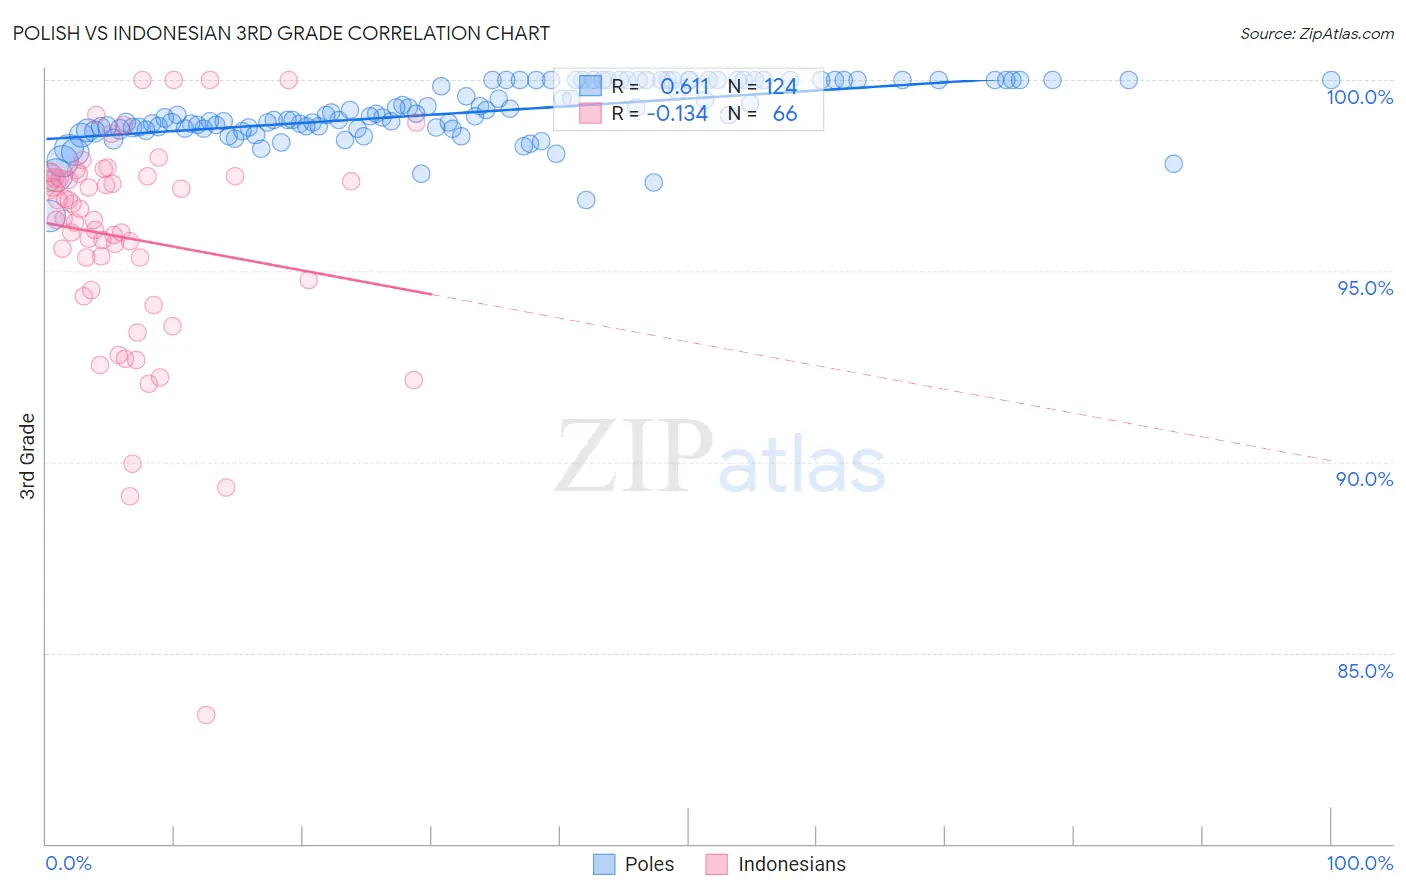
Polish vs Indonesian 3rd Grade Correlation Chart
The statistical analysis conducted on geographies consisting of 560,594,514 people shows a significant positive correlation between the proportion of Poles and percentage of population with at least 3rd grade education in the United States with a correlation coefficient (R) of 0.611 and weighted average of 98.5%. Similarly, the statistical analysis conducted on geographies consisting of 162,727,113 people shows a poor negative correlation between the proportion of Indonesians and percentage of population with at least 3rd grade education in the United States with a correlation coefficient (R) of -0.134 and weighted average of 96.5%, a difference of 2.1%.
3rd Grade Correlation Summary
| Measurement | Polish | Indonesian |
| Minimum | 96.4% | 83.4% |
| Maximum | 100.0% | 100.0% |
| Range | 3.6% | 16.6% |
| Mean | 99.2% | 95.9% |
| Median | 99.1% | 96.5% |
| Interquartile 25% (IQ1) | 98.7% | 94.8% |
| Interquartile 75% (IQ3) | 100.0% | 97.5% |
| Interquartile Range (IQR) | 1.3% | 2.7% |
| Standard Deviation (Sample) | 0.75% | 2.9% |
| Standard Deviation (Population) | 0.74% | 2.9% |
Similar Demographics by 3rd Grade
Demographics Similar to Poles by 3rd Grade
In terms of 3rd grade, the demographic groups most similar to Poles are Pennsylvania German (98.5%, a difference of 0.0%), Irish (98.5%, a difference of 0.010%), Lithuanian (98.5%, a difference of 0.010%), Finnish (98.5%, a difference of 0.010%), and Sioux (98.5%, a difference of 0.010%).
| Demographics | Rating | Rank | 3rd Grade |
| English | 100.0 /100 | #12 | Exceptional 98.6% |
| Tlingit-Haida | 100.0 /100 | #13 | Exceptional 98.5% |
| Carpatho Rusyns | 100.0 /100 | #14 | Exceptional 98.5% |
| Swedes | 100.0 /100 | #15 | Exceptional 98.5% |
| Scottish | 100.0 /100 | #16 | Exceptional 98.5% |
| Dutch | 100.0 /100 | #17 | Exceptional 98.5% |
| Irish | 100.0 /100 | #18 | Exceptional 98.5% |
| Poles | 100.0 /100 | #19 | Exceptional 98.5% |
| Pennsylvania Germans | 100.0 /100 | #20 | Exceptional 98.5% |
| Lithuanians | 100.0 /100 | #21 | Exceptional 98.5% |
| Finns | 100.0 /100 | #22 | Exceptional 98.5% |
| Sioux | 100.0 /100 | #23 | Exceptional 98.5% |
| Danes | 100.0 /100 | #24 | Exceptional 98.5% |
| Scotch-Irish | 100.0 /100 | #25 | Exceptional 98.5% |
| Aleuts | 100.0 /100 | #26 | Exceptional 98.5% |
Demographics Similar to Indonesians by 3rd Grade
In terms of 3rd grade, the demographic groups most similar to Indonesians are Immigrants from Nicaragua (96.5%, a difference of 0.0%), Immigrants from Belize (96.5%, a difference of 0.0%), Vietnamese (96.5%, a difference of 0.010%), Honduran (96.5%, a difference of 0.020%), and Hispanic or Latino (96.5%, a difference of 0.030%).
| Demographics | Rating | Rank | 3rd Grade |
| Belizeans | 0.0 /100 | #314 | Tragic 96.6% |
| Immigrants | Azores | 0.0 /100 | #315 | Tragic 96.6% |
| Immigrants | Burma/Myanmar | 0.0 /100 | #316 | Tragic 96.6% |
| Immigrants | Bangladesh | 0.0 /100 | #317 | Tragic 96.6% |
| Hispanics or Latinos | 0.0 /100 | #318 | Tragic 96.5% |
| Vietnamese | 0.0 /100 | #319 | Tragic 96.5% |
| Immigrants | Nicaragua | 0.0 /100 | #320 | Tragic 96.5% |
| Indonesians | 0.0 /100 | #321 | Tragic 96.5% |
| Immigrants | Belize | 0.0 /100 | #322 | Tragic 96.5% |
| Hondurans | 0.0 /100 | #323 | Tragic 96.5% |
| Dominicans | 0.0 /100 | #324 | Tragic 96.4% |
| Mexican American Indians | 0.0 /100 | #325 | Tragic 96.4% |
| Immigrants | Vietnam | 0.0 /100 | #326 | Tragic 96.4% |
| Japanese | 0.0 /100 | #327 | Tragic 96.4% |
| Bangladeshis | 0.0 /100 | #328 | Tragic 96.3% |