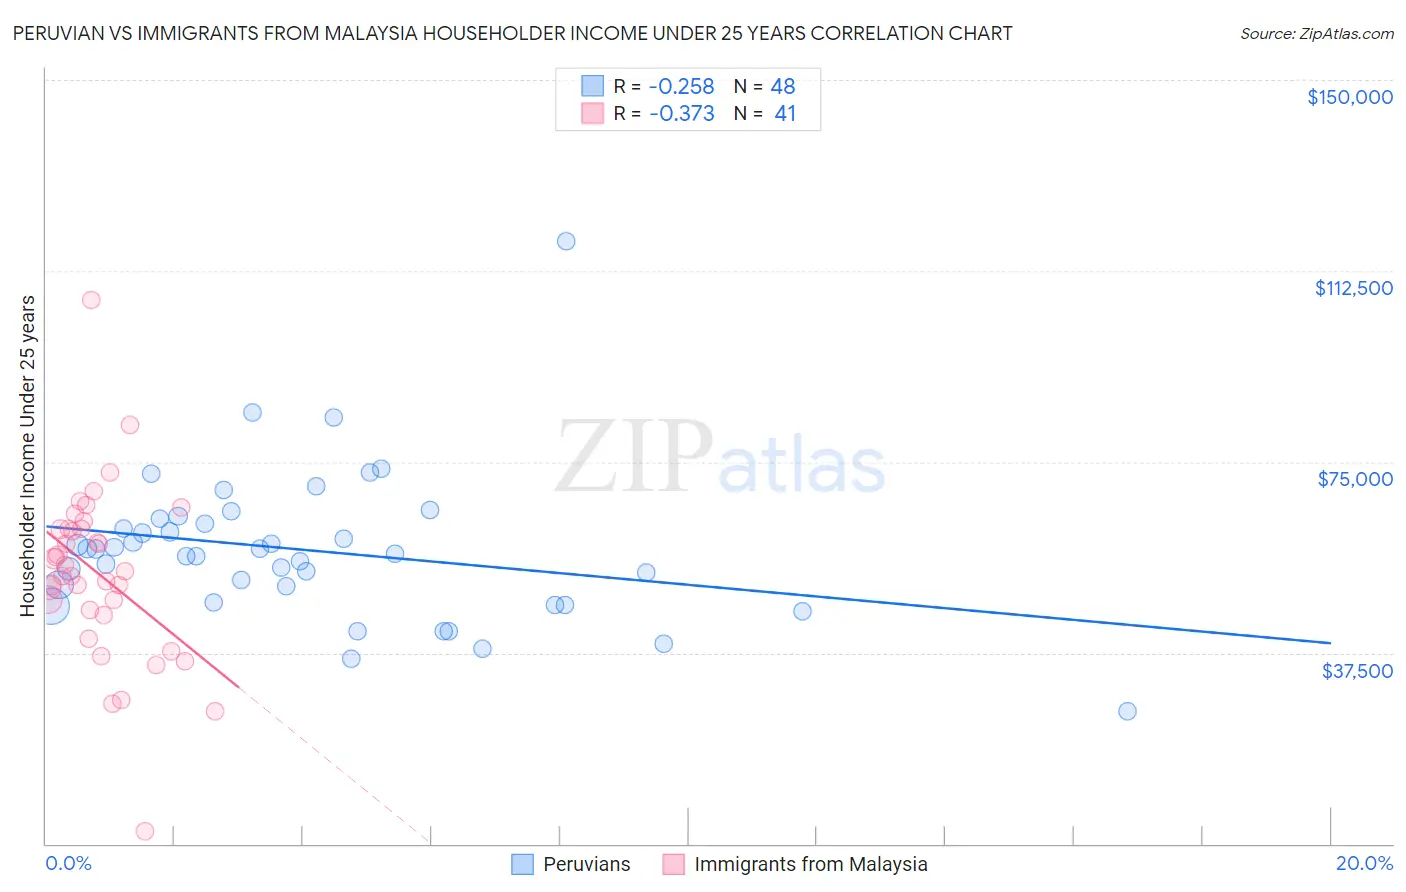
Peruvian vs Immigrants from Malaysia Householder Income Under 25 years
COMPARE
Peruvian
Immigrants from Malaysia
Householder Income Under 25 years
Householder Income Under 25 years Comparison
Peruvians
Immigrants from Malaysia
$56,052
HOUSEHOLDER INCOME UNDER 25 YEARS
100.0/ 100
METRIC RATING
32nd/ 347
METRIC RANK
$54,179
HOUSEHOLDER INCOME UNDER 25 YEARS
99.2/ 100
METRIC RATING
95th/ 347
METRIC RANK
Peruvian vs Immigrants from Malaysia Householder Income Under 25 years Correlation Chart
The statistical analysis conducted on geographies consisting of 309,109,247 people shows a weak negative correlation between the proportion of Peruvians and household income with householder under the age of 25 in the United States with a correlation coefficient (R) of -0.258 and weighted average of $56,052. Similarly, the statistical analysis conducted on geographies consisting of 176,157,143 people shows a mild negative correlation between the proportion of Immigrants from Malaysia and household income with householder under the age of 25 in the United States with a correlation coefficient (R) of -0.373 and weighted average of $54,179, a difference of 3.5%.
Householder Income Under 25 years Correlation Summary
| Measurement | Peruvian | Immigrants from Malaysia |
| Minimum | $25,923 | $2,499 |
| Maximum | $118,438 | $106,721 |
| Range | $92,515 | $104,222 |
| Mean | $57,665 | $53,085 |
| Median | $57,415 | $53,409 |
| Interquartile 25% (IQ1) | $48,987 | $45,363 |
| Interquartile 75% (IQ3) | $63,410 | $61,933 |
| Interquartile Range (IQR) | $14,423 | $16,570 |
| Standard Deviation (Sample) | $14,693 | $17,081 |
| Standard Deviation (Population) | $14,539 | $16,871 |
Similar Demographics by Householder Income Under 25 years
Demographics Similar to Peruvians by Householder Income Under 25 years
In terms of householder income under 25 years, the demographic groups most similar to Peruvians are Vietnamese ($56,127, a difference of 0.13%), Immigrants from Moldova ($56,168, a difference of 0.21%), Inupiat ($55,935, a difference of 0.21%), Immigrants from Japan ($55,932, a difference of 0.21%), and Tlingit-Haida ($55,914, a difference of 0.25%).
| Demographics | Rating | Rank | Householder Income Under 25 years |
| Immigrants | Pakistan | 100.0 /100 | #25 | Exceptional $56,789 |
| Immigrants | Australia | 100.0 /100 | #26 | Exceptional $56,660 |
| Immigrants | North Macedonia | 100.0 /100 | #27 | Exceptional $56,503 |
| Immigrants | Peru | 100.0 /100 | #28 | Exceptional $56,384 |
| Immigrants | Asia | 100.0 /100 | #29 | Exceptional $56,379 |
| Immigrants | Moldova | 100.0 /100 | #30 | Exceptional $56,168 |
| Vietnamese | 100.0 /100 | #31 | Exceptional $56,127 |
| Peruvians | 100.0 /100 | #32 | Exceptional $56,052 |
| Inupiat | 100.0 /100 | #33 | Exceptional $55,935 |
| Immigrants | Japan | 100.0 /100 | #34 | Exceptional $55,932 |
| Tlingit-Haida | 100.0 /100 | #35 | Exceptional $55,914 |
| Immigrants | Israel | 100.0 /100 | #36 | Exceptional $55,913 |
| Immigrants | Russia | 100.0 /100 | #37 | Exceptional $55,891 |
| Immigrants | Iran | 100.0 /100 | #38 | Exceptional $55,880 |
| Immigrants | Belarus | 100.0 /100 | #39 | Exceptional $55,743 |
Demographics Similar to Immigrants from Malaysia by Householder Income Under 25 years
In terms of householder income under 25 years, the demographic groups most similar to Immigrants from Malaysia are Immigrants from Sierra Leone ($54,190, a difference of 0.020%), Immigrants from Argentina ($54,209, a difference of 0.050%), Argentinean ($54,154, a difference of 0.050%), Immigrants from St. Vincent and the Grenadines ($54,230, a difference of 0.090%), and Immigrants from Egypt ($54,239, a difference of 0.11%).
| Demographics | Rating | Rank | Householder Income Under 25 years |
| Yakama | 99.5 /100 | #88 | Exceptional $54,321 |
| Immigrants | South America | 99.4 /100 | #89 | Exceptional $54,268 |
| Turks | 99.4 /100 | #90 | Exceptional $54,266 |
| Immigrants | Egypt | 99.3 /100 | #91 | Exceptional $54,239 |
| Immigrants | St. Vincent and the Grenadines | 99.3 /100 | #92 | Exceptional $54,230 |
| Immigrants | Argentina | 99.3 /100 | #93 | Exceptional $54,209 |
| Immigrants | Sierra Leone | 99.3 /100 | #94 | Exceptional $54,190 |
| Immigrants | Malaysia | 99.2 /100 | #95 | Exceptional $54,179 |
| Argentineans | 99.2 /100 | #96 | Exceptional $54,154 |
| Immigrants | Portugal | 99.1 /100 | #97 | Exceptional $54,105 |
| Eastern Europeans | 99.0 /100 | #98 | Exceptional $54,066 |
| Alaska Natives | 98.8 /100 | #99 | Exceptional $54,000 |
| Immigrants | Kazakhstan | 98.8 /100 | #100 | Exceptional $53,990 |
| South Americans | 98.6 /100 | #101 | Exceptional $53,939 |
| Ecuadorians | 98.5 /100 | #102 | Exceptional $53,911 |