Peruvian vs Bhutanese Householder Income Under 25 years
COMPARE
Peruvian
Bhutanese
Householder Income Under 25 years
Householder Income Under 25 years Comparison
Peruvians
Bhutanese
$56,052
HOUSEHOLDER INCOME UNDER 25 YEARS
100.0/ 100
METRIC RATING
32nd/ 347
METRIC RANK
$57,078
HOUSEHOLDER INCOME UNDER 25 YEARS
100.0/ 100
METRIC RATING
19th/ 347
METRIC RANK
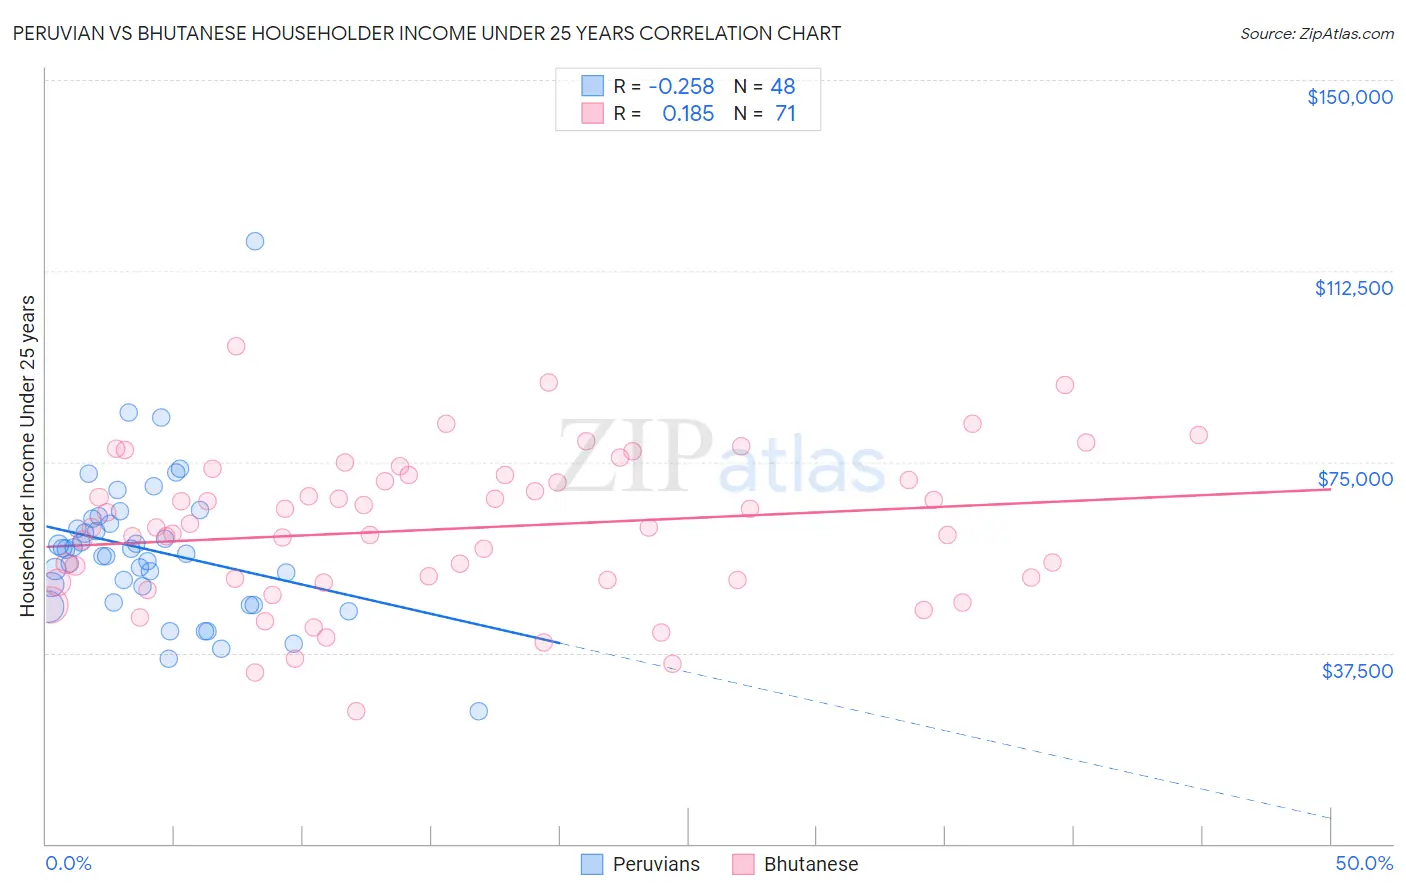
Peruvian vs Bhutanese Householder Income Under 25 years Correlation Chart
The statistical analysis conducted on geographies consisting of 309,109,247 people shows a weak negative correlation between the proportion of Peruvians and household income with householder under the age of 25 in the United States with a correlation coefficient (R) of -0.258 and weighted average of $56,052. Similarly, the statistical analysis conducted on geographies consisting of 378,977,160 people shows a poor positive correlation between the proportion of Bhutanese and household income with householder under the age of 25 in the United States with a correlation coefficient (R) of 0.185 and weighted average of $57,078, a difference of 1.8%.
Householder Income Under 25 years Correlation Summary
| Measurement | Peruvian | Bhutanese |
| Minimum | $25,923 | $26,023 |
| Maximum | $118,438 | $97,652 |
| Range | $92,515 | $71,629 |
| Mean | $57,665 | $61,820 |
| Median | $57,415 | $62,088 |
| Interquartile 25% (IQ1) | $48,987 | $51,736 |
| Interquartile 75% (IQ3) | $63,410 | $72,371 |
| Interquartile Range (IQR) | $14,423 | $20,635 |
| Standard Deviation (Sample) | $14,693 | $14,588 |
| Standard Deviation (Population) | $14,539 | $14,485 |
Demographics Similar to Peruvians and Bhutanese by Householder Income Under 25 years
In terms of householder income under 25 years, the demographic groups most similar to Peruvians are Vietnamese ($56,127, a difference of 0.13%), Immigrants from Moldova ($56,168, a difference of 0.21%), Inupiat ($55,935, a difference of 0.21%), Immigrants from Japan ($55,932, a difference of 0.21%), and Tlingit-Haida ($55,914, a difference of 0.25%). Similarly, the demographic groups most similar to Bhutanese are Immigrants from Ireland ($57,075, a difference of 0.010%), Immigrants from Fiji ($57,074, a difference of 0.010%), Immigrants from Eastern Asia ($57,123, a difference of 0.080%), Asian ($57,003, a difference of 0.13%), and Tongan ($56,972, a difference of 0.18%).
| Demographics | Rating | Rank | Householder Income Under 25 years |
| Koreans | 100.0 /100 | #15 | Exceptional $57,730 |
| Immigrants | Afghanistan | 100.0 /100 | #16 | Exceptional $57,478 |
| Sierra Leoneans | 100.0 /100 | #17 | Exceptional $57,272 |
| Immigrants | Eastern Asia | 100.0 /100 | #18 | Exceptional $57,123 |
| Bhutanese | 100.0 /100 | #19 | Exceptional $57,078 |
| Immigrants | Ireland | 100.0 /100 | #20 | Exceptional $57,075 |
| Immigrants | Fiji | 100.0 /100 | #21 | Exceptional $57,074 |
| Asians | 100.0 /100 | #22 | Exceptional $57,003 |
| Tongans | 100.0 /100 | #23 | Exceptional $56,972 |
| Immigrants | Singapore | 100.0 /100 | #24 | Exceptional $56,835 |
| Immigrants | Pakistan | 100.0 /100 | #25 | Exceptional $56,789 |
| Immigrants | Australia | 100.0 /100 | #26 | Exceptional $56,660 |
| Immigrants | North Macedonia | 100.0 /100 | #27 | Exceptional $56,503 |
| Immigrants | Peru | 100.0 /100 | #28 | Exceptional $56,384 |
| Immigrants | Asia | 100.0 /100 | #29 | Exceptional $56,379 |
| Immigrants | Moldova | 100.0 /100 | #30 | Exceptional $56,168 |
| Vietnamese | 100.0 /100 | #31 | Exceptional $56,127 |
| Peruvians | 100.0 /100 | #32 | Exceptional $56,052 |
| Inupiat | 100.0 /100 | #33 | Exceptional $55,935 |
| Immigrants | Japan | 100.0 /100 | #34 | Exceptional $55,932 |
| Tlingit-Haida | 100.0 /100 | #35 | Exceptional $55,914 |