Slovene vs Immigrants from South America Median Household Income
COMPARE
Slovene
Immigrants from South America
Median Household Income
Median Household Income Comparison
Slovenes
Immigrants from South America
$85,562
MEDIAN HOUSEHOLD INCOME
57.4/ 100
METRIC RATING
172nd/ 347
METRIC RANK
$85,611
MEDIAN HOUSEHOLD INCOME
58.1/ 100
METRIC RATING
171st/ 347
METRIC RANK
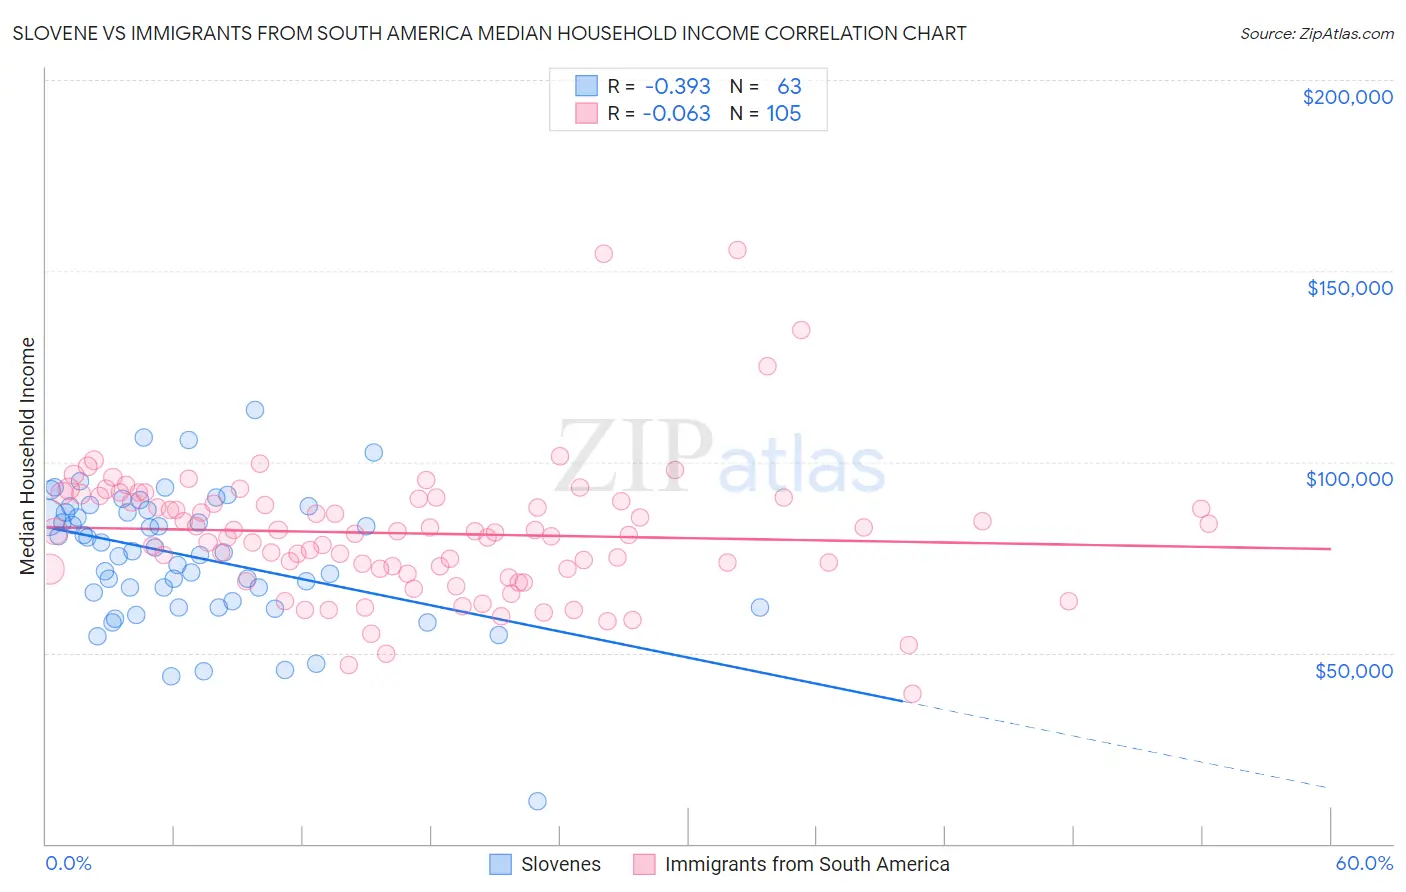
Slovene vs Immigrants from South America Median Household Income Correlation Chart
The statistical analysis conducted on geographies consisting of 261,226,883 people shows a mild negative correlation between the proportion of Slovenes and median household income in the United States with a correlation coefficient (R) of -0.393 and weighted average of $85,562. Similarly, the statistical analysis conducted on geographies consisting of 485,852,946 people shows a slight negative correlation between the proportion of Immigrants from South America and median household income in the United States with a correlation coefficient (R) of -0.063 and weighted average of $85,611, a difference of 0.060%.
Median Household Income Correlation Summary
| Measurement | Slovene | Immigrants from South America |
| Minimum | $11,161 | $39,375 |
| Maximum | $113,650 | $155,583 |
| Range | $102,489 | $116,208 |
| Mean | $75,280 | $81,259 |
| Median | $76,693 | $81,529 |
| Interquartile 25% (IQ1) | $63,438 | $71,899 |
| Interquartile 75% (IQ3) | $87,449 | $90,608 |
| Interquartile Range (IQR) | $24,011 | $18,709 |
| Standard Deviation (Sample) | $17,550 | $17,852 |
| Standard Deviation (Population) | $17,410 | $17,766 |
Demographics Similar to Slovenes and Immigrants from South America by Median Household Income
In terms of median household income, the demographic groups most similar to Slovenes are Swiss ($85,681, a difference of 0.14%), Colombian ($85,716, a difference of 0.18%), Icelander ($85,797, a difference of 0.27%), Immigrants from Cameroon ($85,314, a difference of 0.29%), and Immigrants ($85,818, a difference of 0.30%). Similarly, the demographic groups most similar to Immigrants from South America are Swiss ($85,681, a difference of 0.080%), Colombian ($85,716, a difference of 0.12%), Icelander ($85,797, a difference of 0.22%), Immigrants ($85,818, a difference of 0.24%), and Immigrants from Cameroon ($85,314, a difference of 0.35%).
| Demographics | Rating | Rank | Median Household Income |
| Slavs | 69.7 /100 | #161 | Good $86,398 |
| Guamanians/Chamorros | 67.7 /100 | #162 | Good $86,255 |
| Czechs | 66.4 /100 | #163 | Good $86,164 |
| Irish | 66.2 /100 | #164 | Good $86,145 |
| Norwegians | 65.3 /100 | #165 | Good $86,084 |
| Scandinavians | 65.1 /100 | #166 | Good $86,073 |
| Immigrants | Immigrants | 61.3 /100 | #167 | Good $85,818 |
| Icelanders | 61.0 /100 | #168 | Good $85,797 |
| Colombians | 59.7 /100 | #169 | Average $85,716 |
| Swiss | 59.2 /100 | #170 | Average $85,681 |
| Immigrants | South America | 58.1 /100 | #171 | Average $85,611 |
| Slovenes | 57.4 /100 | #172 | Average $85,562 |
| Immigrants | Cameroon | 53.4 /100 | #173 | Average $85,314 |
| Scottish | 50.0 /100 | #174 | Average $85,101 |
| Immigrants | Costa Rica | 49.2 /100 | #175 | Average $85,054 |
| Alsatians | 49.2 /100 | #176 | Average $85,053 |
| Immigrants | Eritrea | 48.8 /100 | #177 | Average $85,025 |
| Czechoslovakians | 47.8 /100 | #178 | Average $84,965 |
| English | 47.0 /100 | #179 | Average $84,915 |
| Immigrants | Portugal | 44.2 /100 | #180 | Average $84,740 |
| Hawaiians | 44.1 /100 | #181 | Average $84,729 |