Marshallese vs Immigrants from South America Median Household Income
COMPARE
Marshallese
Immigrants from South America
Median Household Income
Median Household Income Comparison
Marshallese
Immigrants from South America
$78,930
MEDIAN HOUSEHOLD INCOME
1.9/ 100
METRIC RATING
244th/ 347
METRIC RANK
$85,611
MEDIAN HOUSEHOLD INCOME
58.1/ 100
METRIC RATING
171st/ 347
METRIC RANK
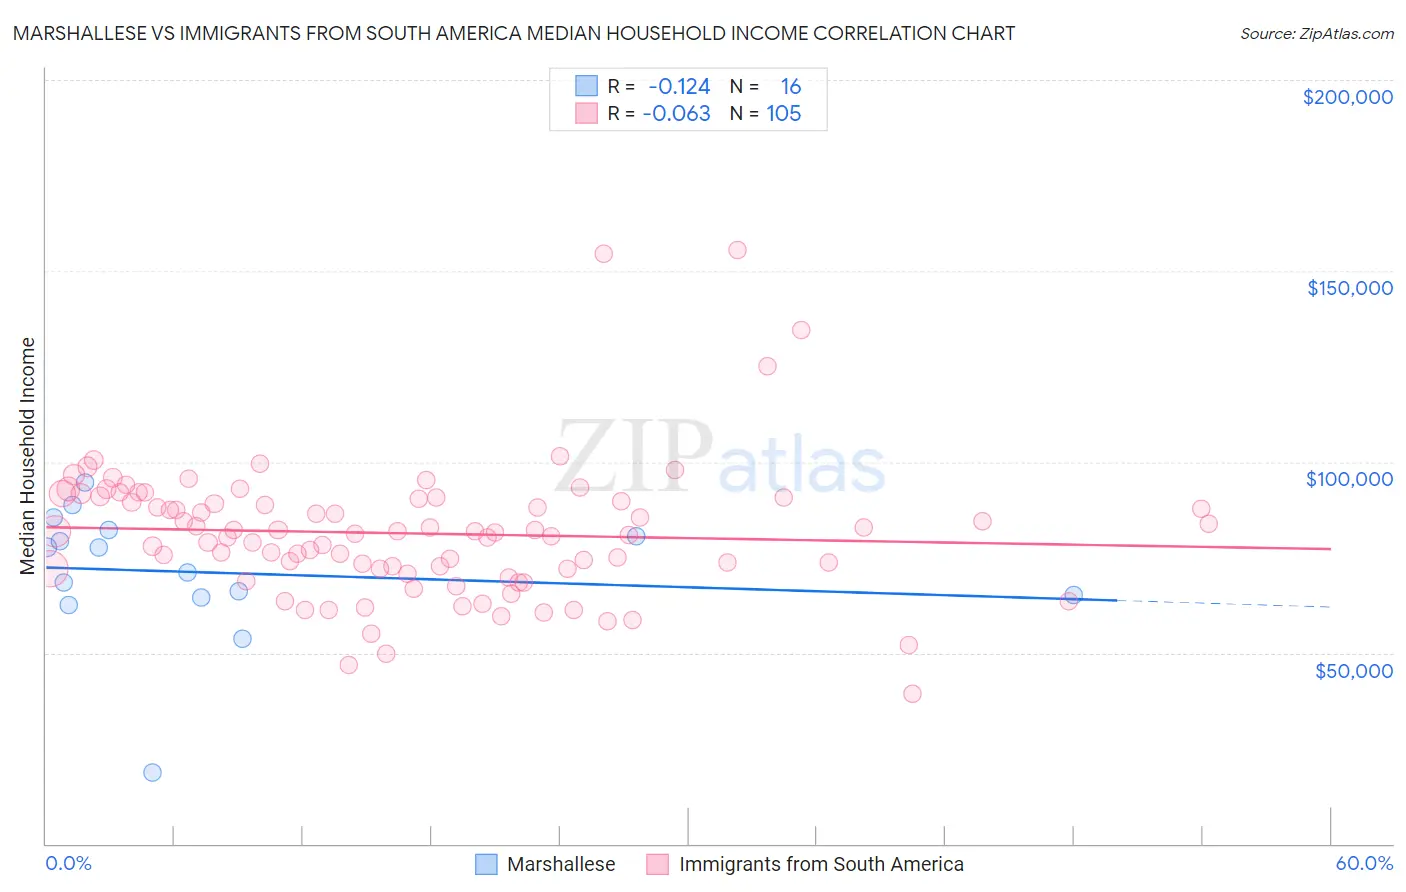
Marshallese vs Immigrants from South America Median Household Income Correlation Chart
The statistical analysis conducted on geographies consisting of 14,761,315 people shows a poor negative correlation between the proportion of Marshallese and median household income in the United States with a correlation coefficient (R) of -0.124 and weighted average of $78,930. Similarly, the statistical analysis conducted on geographies consisting of 485,852,946 people shows a slight negative correlation between the proportion of Immigrants from South America and median household income in the United States with a correlation coefficient (R) of -0.063 and weighted average of $85,611, a difference of 8.5%.
Median Household Income Correlation Summary
| Measurement | Marshallese | Immigrants from South America |
| Minimum | $18,739 | $39,375 |
| Maximum | $94,608 | $155,583 |
| Range | $75,869 | $116,208 |
| Mean | $71,002 | $81,259 |
| Median | $74,280 | $81,529 |
| Interquartile 25% (IQ1) | $64,792 | $71,899 |
| Interquartile 75% (IQ3) | $81,406 | $90,608 |
| Interquartile Range (IQR) | $16,615 | $18,709 |
| Standard Deviation (Sample) | $17,620 | $17,852 |
| Standard Deviation (Population) | $17,060 | $17,766 |
Similar Demographics by Median Household Income
Demographics Similar to Marshallese by Median Household Income
In terms of median household income, the demographic groups most similar to Marshallese are Immigrants from Barbados ($78,989, a difference of 0.080%), Inupiat ($78,841, a difference of 0.11%), Central American ($78,803, a difference of 0.16%), Immigrants from Sudan ($79,103, a difference of 0.22%), and Immigrants from Burma/Myanmar ($78,682, a difference of 0.32%).
| Demographics | Rating | Rank | Median Household Income |
| Nicaraguans | 3.1 /100 | #237 | Tragic $79,737 |
| Barbadians | 3.0 /100 | #238 | Tragic $79,664 |
| Alaska Natives | 2.7 /100 | #239 | Tragic $79,509 |
| Immigrants | Western Africa | 2.7 /100 | #240 | Tragic $79,490 |
| Immigrants | Nonimmigrants | 2.6 /100 | #241 | Tragic $79,429 |
| Immigrants | Sudan | 2.1 /100 | #242 | Tragic $79,103 |
| Immigrants | Barbados | 1.9 /100 | #243 | Tragic $78,989 |
| Marshallese | 1.9 /100 | #244 | Tragic $78,930 |
| Inupiat | 1.8 /100 | #245 | Tragic $78,841 |
| Central Americans | 1.7 /100 | #246 | Tragic $78,803 |
| Immigrants | Burma/Myanmar | 1.6 /100 | #247 | Tragic $78,682 |
| Sudanese | 1.5 /100 | #248 | Tragic $78,529 |
| West Indians | 1.4 /100 | #249 | Tragic $78,455 |
| Immigrants | Laos | 1.3 /100 | #250 | Tragic $78,327 |
| Mexican American Indians | 1.2 /100 | #251 | Tragic $78,166 |
Demographics Similar to Immigrants from South America by Median Household Income
In terms of median household income, the demographic groups most similar to Immigrants from South America are Slovene ($85,562, a difference of 0.060%), Swiss ($85,681, a difference of 0.080%), Colombian ($85,716, a difference of 0.12%), Icelander ($85,797, a difference of 0.22%), and Immigrants ($85,818, a difference of 0.24%).
| Demographics | Rating | Rank | Median Household Income |
| Irish | 66.2 /100 | #164 | Good $86,145 |
| Norwegians | 65.3 /100 | #165 | Good $86,084 |
| Scandinavians | 65.1 /100 | #166 | Good $86,073 |
| Immigrants | Immigrants | 61.3 /100 | #167 | Good $85,818 |
| Icelanders | 61.0 /100 | #168 | Good $85,797 |
| Colombians | 59.7 /100 | #169 | Average $85,716 |
| Swiss | 59.2 /100 | #170 | Average $85,681 |
| Immigrants | South America | 58.1 /100 | #171 | Average $85,611 |
| Slovenes | 57.4 /100 | #172 | Average $85,562 |
| Immigrants | Cameroon | 53.4 /100 | #173 | Average $85,314 |
| Scottish | 50.0 /100 | #174 | Average $85,101 |
| Immigrants | Costa Rica | 49.2 /100 | #175 | Average $85,054 |
| Alsatians | 49.2 /100 | #176 | Average $85,053 |
| Immigrants | Eritrea | 48.8 /100 | #177 | Average $85,025 |
| Czechoslovakians | 47.8 /100 | #178 | Average $84,965 |