Immigrants from Burma/Myanmar vs Immigrants from South America Median Household Income
COMPARE
Immigrants from Burma/Myanmar
Immigrants from South America
Median Household Income
Median Household Income Comparison
Immigrants from Burma/Myanmar
Immigrants from South America
$78,682
MEDIAN HOUSEHOLD INCOME
1.6/ 100
METRIC RATING
247th/ 347
METRIC RANK
$85,611
MEDIAN HOUSEHOLD INCOME
58.1/ 100
METRIC RATING
171st/ 347
METRIC RANK
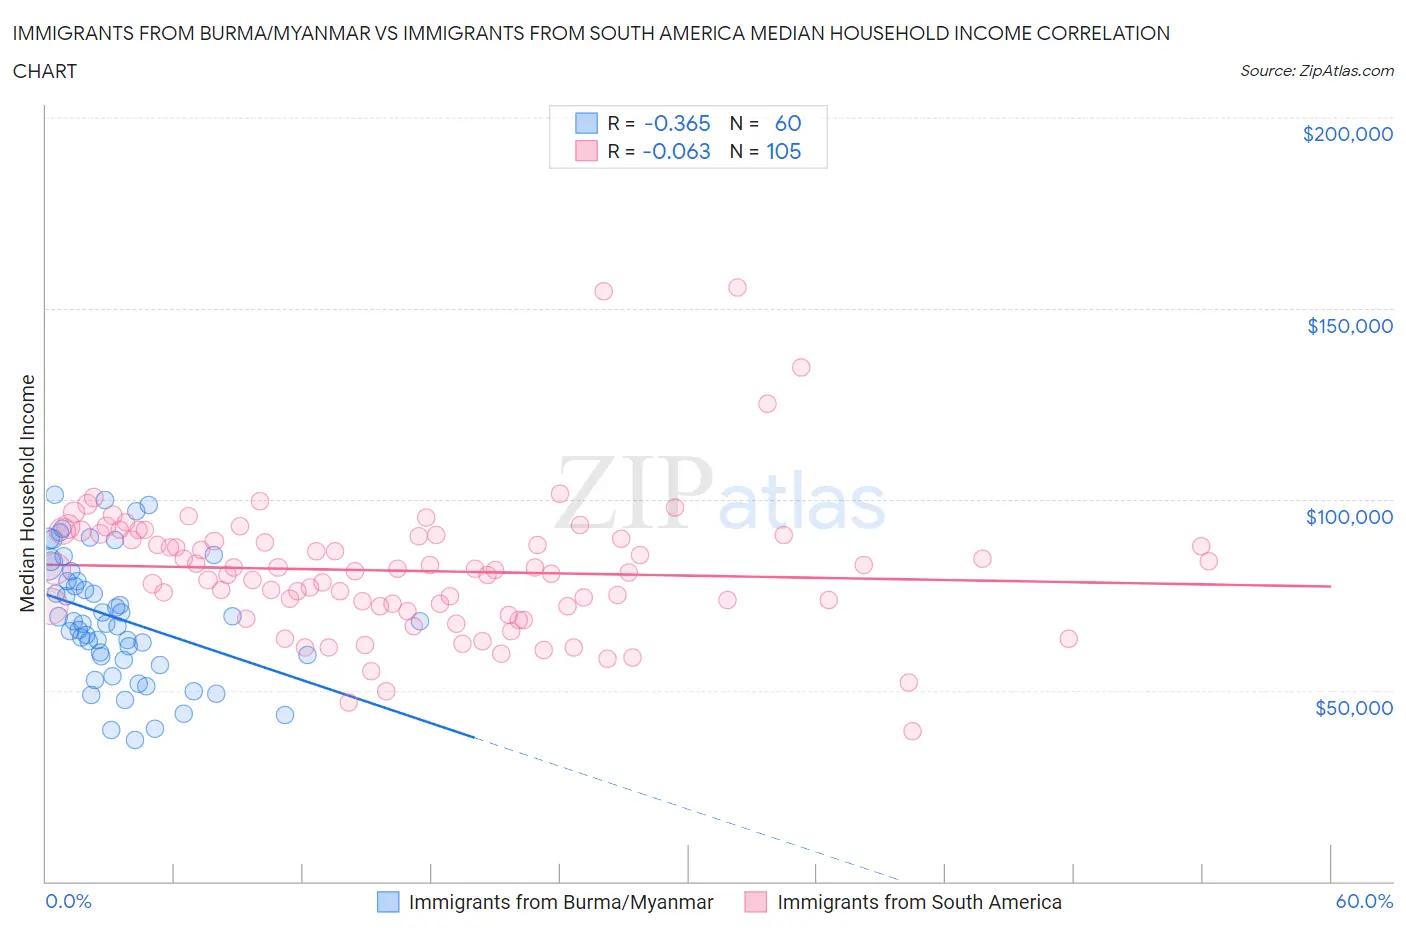
Immigrants from Burma/Myanmar vs Immigrants from South America Median Household Income Correlation Chart
The statistical analysis conducted on geographies consisting of 172,235,466 people shows a mild negative correlation between the proportion of Immigrants from Burma/Myanmar and median household income in the United States with a correlation coefficient (R) of -0.365 and weighted average of $78,682. Similarly, the statistical analysis conducted on geographies consisting of 485,852,946 people shows a slight negative correlation between the proportion of Immigrants from South America and median household income in the United States with a correlation coefficient (R) of -0.063 and weighted average of $85,611, a difference of 8.8%.
Median Household Income Correlation Summary
| Measurement | Immigrants from Burma/Myanmar | Immigrants from South America |
| Minimum | $36,966 | $39,375 |
| Maximum | $101,230 | $155,583 |
| Range | $64,264 | $116,208 |
| Mean | $68,823 | $81,259 |
| Median | $67,779 | $81,529 |
| Interquartile 25% (IQ1) | $58,487 | $71,899 |
| Interquartile 75% (IQ3) | $79,866 | $90,608 |
| Interquartile Range (IQR) | $21,379 | $18,709 |
| Standard Deviation (Sample) | $16,228 | $17,852 |
| Standard Deviation (Population) | $16,092 | $17,766 |
Similar Demographics by Median Household Income
Demographics Similar to Immigrants from Burma/Myanmar by Median Household Income
In terms of median household income, the demographic groups most similar to Immigrants from Burma/Myanmar are Central American ($78,803, a difference of 0.15%), Sudanese ($78,529, a difference of 0.19%), Inupiat ($78,841, a difference of 0.20%), West Indian ($78,455, a difference of 0.29%), and Marshallese ($78,930, a difference of 0.32%).
| Demographics | Rating | Rank | Median Household Income |
| Immigrants | Western Africa | 2.7 /100 | #240 | Tragic $79,490 |
| Immigrants | Nonimmigrants | 2.6 /100 | #241 | Tragic $79,429 |
| Immigrants | Sudan | 2.1 /100 | #242 | Tragic $79,103 |
| Immigrants | Barbados | 1.9 /100 | #243 | Tragic $78,989 |
| Marshallese | 1.9 /100 | #244 | Tragic $78,930 |
| Inupiat | 1.8 /100 | #245 | Tragic $78,841 |
| Central Americans | 1.7 /100 | #246 | Tragic $78,803 |
| Immigrants | Burma/Myanmar | 1.6 /100 | #247 | Tragic $78,682 |
| Sudanese | 1.5 /100 | #248 | Tragic $78,529 |
| West Indians | 1.4 /100 | #249 | Tragic $78,455 |
| Immigrants | Laos | 1.3 /100 | #250 | Tragic $78,327 |
| Mexican American Indians | 1.2 /100 | #251 | Tragic $78,166 |
| Immigrants | West Indies | 1.0 /100 | #252 | Tragic $77,956 |
| Immigrants | St. Vincent and the Grenadines | 0.9 /100 | #253 | Tragic $77,690 |
| Sub-Saharan Africans | 0.8 /100 | #254 | Tragic $77,631 |
Demographics Similar to Immigrants from South America by Median Household Income
In terms of median household income, the demographic groups most similar to Immigrants from South America are Slovene ($85,562, a difference of 0.060%), Swiss ($85,681, a difference of 0.080%), Colombian ($85,716, a difference of 0.12%), Icelander ($85,797, a difference of 0.22%), and Immigrants ($85,818, a difference of 0.24%).
| Demographics | Rating | Rank | Median Household Income |
| Irish | 66.2 /100 | #164 | Good $86,145 |
| Norwegians | 65.3 /100 | #165 | Good $86,084 |
| Scandinavians | 65.1 /100 | #166 | Good $86,073 |
| Immigrants | Immigrants | 61.3 /100 | #167 | Good $85,818 |
| Icelanders | 61.0 /100 | #168 | Good $85,797 |
| Colombians | 59.7 /100 | #169 | Average $85,716 |
| Swiss | 59.2 /100 | #170 | Average $85,681 |
| Immigrants | South America | 58.1 /100 | #171 | Average $85,611 |
| Slovenes | 57.4 /100 | #172 | Average $85,562 |
| Immigrants | Cameroon | 53.4 /100 | #173 | Average $85,314 |
| Scottish | 50.0 /100 | #174 | Average $85,101 |
| Immigrants | Costa Rica | 49.2 /100 | #175 | Average $85,054 |
| Alsatians | 49.2 /100 | #176 | Average $85,053 |
| Immigrants | Eritrea | 48.8 /100 | #177 | Average $85,025 |
| Czechoslovakians | 47.8 /100 | #178 | Average $84,965 |