Peruvian vs Immigrants from South America Median Female Earnings
COMPARE
Peruvian
Immigrants from South America
Median Female Earnings
Median Female Earnings Comparison
Peruvians
Immigrants from South America
$40,234
MEDIAN FEMALE EARNINGS
75.3/ 100
METRIC RATING
156th/ 347
METRIC RANK
$39,643
MEDIAN FEMALE EARNINGS
47.2/ 100
METRIC RATING
175th/ 347
METRIC RANK
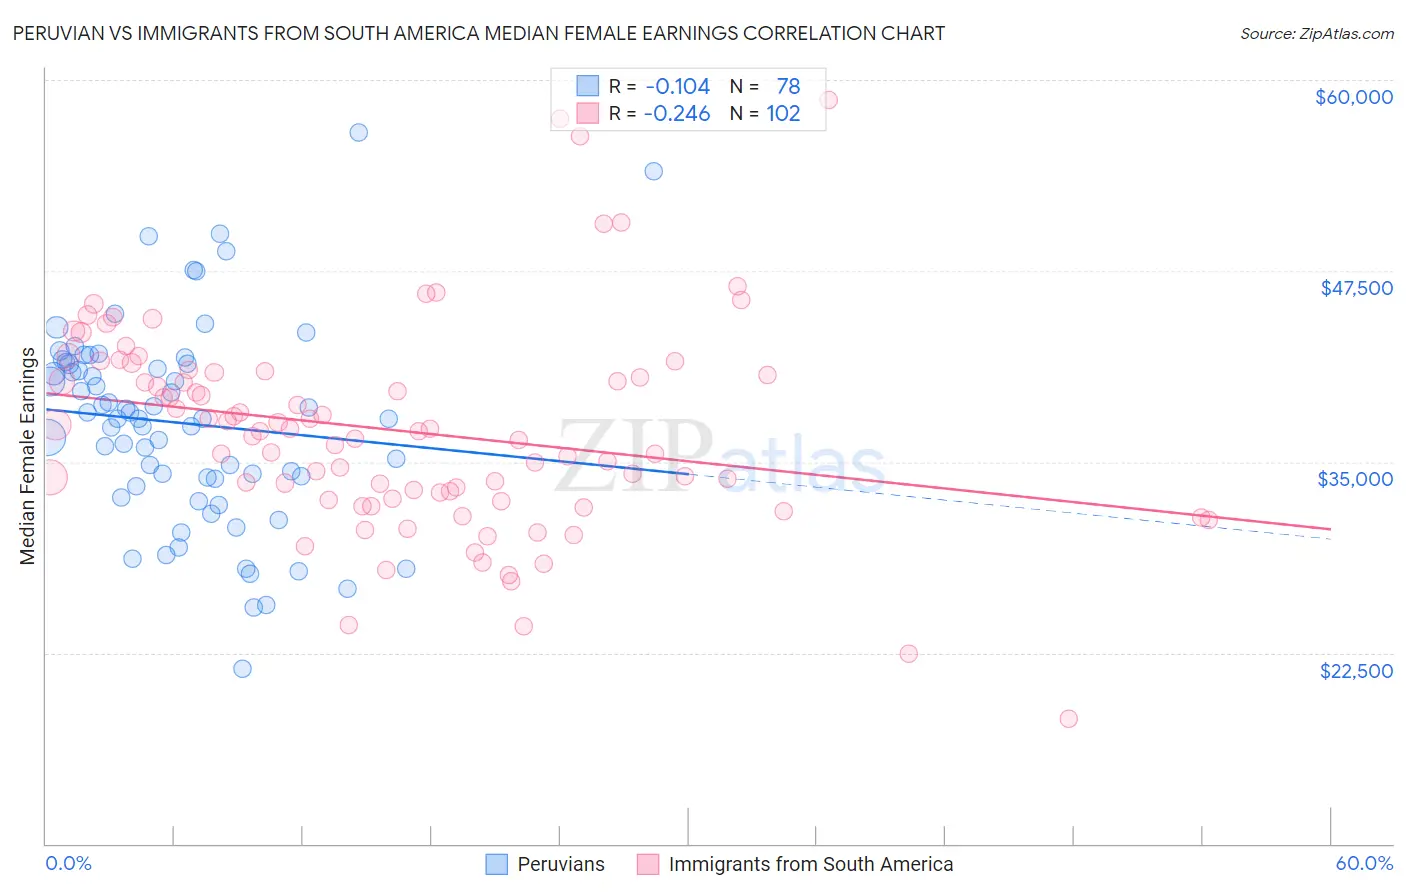
Peruvian vs Immigrants from South America Median Female Earnings Correlation Chart
The statistical analysis conducted on geographies consisting of 363,169,099 people shows a poor negative correlation between the proportion of Peruvians and median female earnings in the United States with a correlation coefficient (R) of -0.104 and weighted average of $40,234. Similarly, the statistical analysis conducted on geographies consisting of 486,047,092 people shows a weak negative correlation between the proportion of Immigrants from South America and median female earnings in the United States with a correlation coefficient (R) of -0.246 and weighted average of $39,643, a difference of 1.5%.
Median Female Earnings Correlation Summary
| Measurement | Peruvian | Immigrants from South America |
| Minimum | $21,456 | $18,150 |
| Maximum | $56,528 | $58,709 |
| Range | $35,072 | $40,559 |
| Mean | $37,547 | $37,049 |
| Median | $37,836 | $37,037 |
| Interquartile 25% (IQ1) | $33,920 | $32,572 |
| Interquartile 75% (IQ3) | $41,414 | $40,849 |
| Interquartile Range (IQR) | $7,494 | $8,277 |
| Standard Deviation (Sample) | $6,584 | $6,851 |
| Standard Deviation (Population) | $6,542 | $6,817 |
Demographics Similar to Peruvians and Immigrants from South America by Median Female Earnings
In terms of median female earnings, the demographic groups most similar to Peruvians are Immigrants from Africa ($40,257, a difference of 0.060%), Portuguese ($40,177, a difference of 0.14%), Immigrants from Senegal ($40,157, a difference of 0.19%), Immigrants from Vietnam ($40,153, a difference of 0.20%), and Inupiat ($40,080, a difference of 0.38%). Similarly, the demographic groups most similar to Immigrants from South America are South American ($39,698, a difference of 0.14%), Canadian ($39,724, a difference of 0.20%), British ($39,772, a difference of 0.32%), Immigrants from Portugal ($39,788, a difference of 0.37%), and Slovene ($39,817, a difference of 0.44%).
| Demographics | Rating | Rank | Median Female Earnings |
| Immigrants | Africa | 76.2 /100 | #155 | Good $40,257 |
| Peruvians | 75.3 /100 | #156 | Good $40,234 |
| Portuguese | 73.0 /100 | #157 | Good $40,177 |
| Immigrants | Senegal | 72.2 /100 | #158 | Good $40,157 |
| Immigrants | Vietnam | 72.0 /100 | #159 | Good $40,153 |
| Inupiat | 68.9 /100 | #160 | Good $40,080 |
| Alsatians | 68.0 /100 | #161 | Good $40,060 |
| South American Indians | 66.1 /100 | #162 | Good $40,019 |
| Lebanese | 65.5 /100 | #163 | Good $40,006 |
| Immigrants | Saudi Arabia | 62.9 /100 | #164 | Good $39,952 |
| Immigrants | Bangladesh | 60.8 /100 | #165 | Good $39,910 |
| Immigrants | Ghana | 60.0 /100 | #166 | Good $39,894 |
| Luxembourgers | 59.9 /100 | #167 | Average $39,891 |
| Immigrants | Peru | 58.9 /100 | #168 | Average $39,871 |
| Kenyans | 58.4 /100 | #169 | Average $39,860 |
| Slovenes | 56.2 /100 | #170 | Average $39,817 |
| Immigrants | Portugal | 54.7 /100 | #171 | Average $39,788 |
| British | 53.8 /100 | #172 | Average $39,772 |
| Canadians | 51.4 /100 | #173 | Average $39,724 |
| South Americans | 50.0 /100 | #174 | Average $39,698 |
| Immigrants | South America | 47.2 /100 | #175 | Average $39,643 |