Palestinian vs Immigrants from Moldova Median Household Income
COMPARE
Palestinian
Immigrants from Moldova
Median Household Income
Median Household Income Comparison
Palestinians
Immigrants from Moldova
$90,574
MEDIAN HOUSEHOLD INCOME
97.1/ 100
METRIC RATING
110th/ 347
METRIC RANK
$91,446
MEDIAN HOUSEHOLD INCOME
98.3/ 100
METRIC RATING
101st/ 347
METRIC RANK
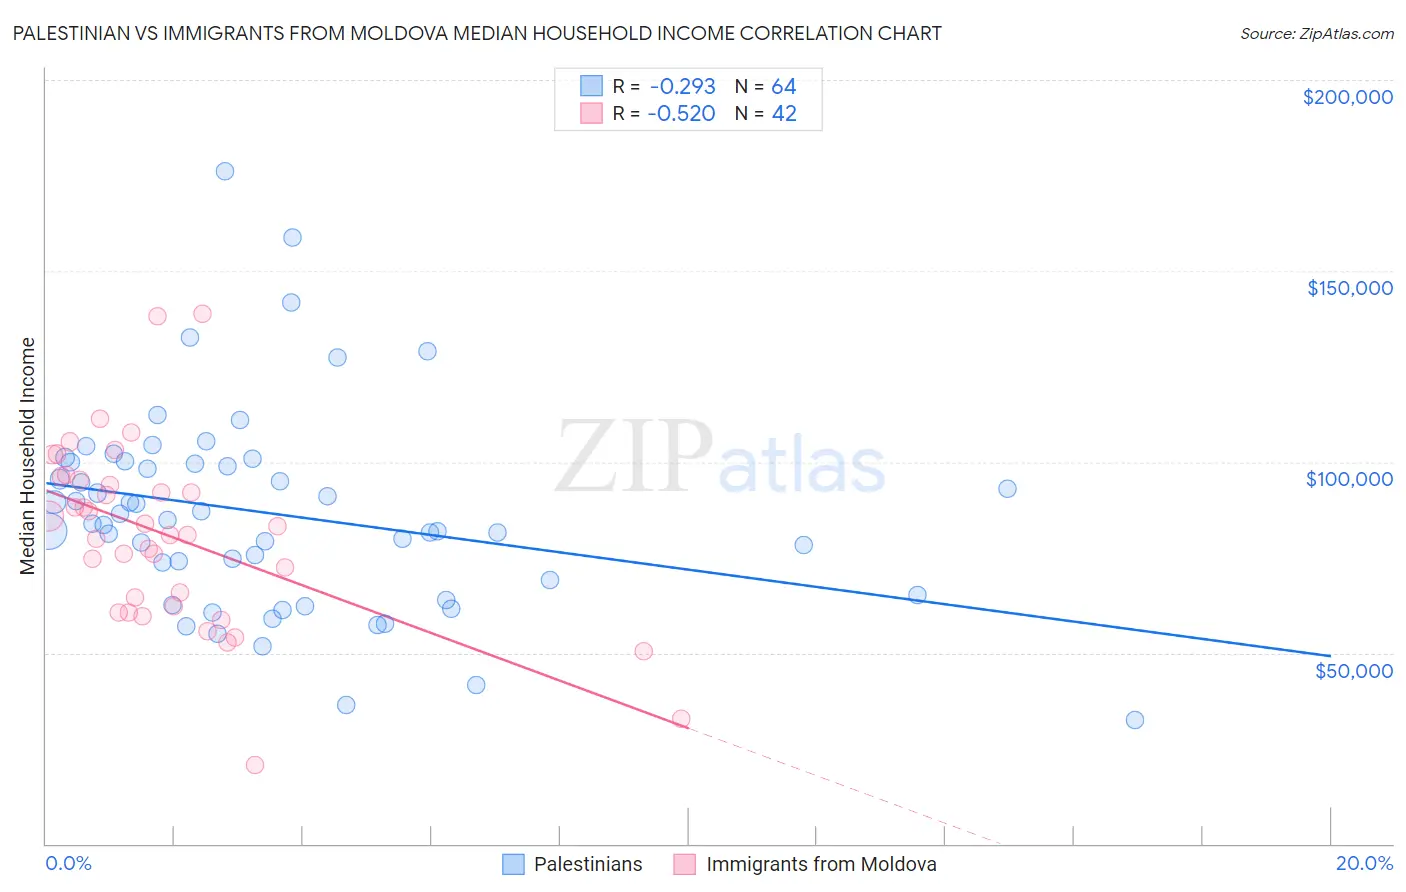
Palestinian vs Immigrants from Moldova Median Household Income Correlation Chart
The statistical analysis conducted on geographies consisting of 216,355,198 people shows a weak negative correlation between the proportion of Palestinians and median household income in the United States with a correlation coefficient (R) of -0.293 and weighted average of $90,574. Similarly, the statistical analysis conducted on geographies consisting of 124,363,535 people shows a substantial negative correlation between the proportion of Immigrants from Moldova and median household income in the United States with a correlation coefficient (R) of -0.520 and weighted average of $91,446, a difference of 0.96%.
Median Household Income Correlation Summary
| Measurement | Palestinian | Immigrants from Moldova |
| Minimum | $32,375 | $20,699 |
| Maximum | $176,058 | $138,879 |
| Range | $143,683 | $118,180 |
| Mean | $86,299 | $80,883 |
| Median | $84,304 | $82,096 |
| Interquartile 25% (IQ1) | $67,018 | $62,083 |
| Interquartile 75% (IQ3) | $99,711 | $95,143 |
| Interquartile Range (IQR) | $32,693 | $33,060 |
| Standard Deviation (Sample) | $26,509 | $23,912 |
| Standard Deviation (Population) | $26,301 | $23,626 |
Demographics Similar to Palestinians and Immigrants from Moldova by Median Household Income
In terms of median household income, the demographic groups most similar to Palestinians are Chilean ($90,605, a difference of 0.030%), Immigrants from Poland ($90,549, a difference of 0.030%), Zimbabwean ($90,618, a difference of 0.050%), Croatian ($90,685, a difference of 0.12%), and Northern European ($90,446, a difference of 0.14%). Similarly, the demographic groups most similar to Immigrants from Moldova are Ukrainian ($91,456, a difference of 0.010%), Immigrants from South Eastern Asia ($91,541, a difference of 0.10%), Austrian ($91,339, a difference of 0.12%), Immigrants from Southern Europe ($91,605, a difference of 0.17%), and Immigrants from Serbia ($91,730, a difference of 0.31%).
| Demographics | Rating | Rank | Median Household Income |
| Armenians | 98.7 /100 | #95 | Exceptional $91,807 |
| Jordanians | 98.7 /100 | #96 | Exceptional $91,794 |
| Immigrants | Serbia | 98.6 /100 | #97 | Exceptional $91,730 |
| Immigrants | Southern Europe | 98.5 /100 | #98 | Exceptional $91,605 |
| Immigrants | South Eastern Asia | 98.4 /100 | #99 | Exceptional $91,541 |
| Ukrainians | 98.3 /100 | #100 | Exceptional $91,456 |
| Immigrants | Moldova | 98.3 /100 | #101 | Exceptional $91,446 |
| Austrians | 98.2 /100 | #102 | Exceptional $91,339 |
| Immigrants | Ukraine | 98.0 /100 | #103 | Exceptional $91,124 |
| Immigrants | Kazakhstan | 97.8 /100 | #104 | Exceptional $91,015 |
| Immigrants | Brazil | 97.7 /100 | #105 | Exceptional $90,907 |
| Macedonians | 97.4 /100 | #106 | Exceptional $90,761 |
| Croatians | 97.3 /100 | #107 | Exceptional $90,685 |
| Zimbabweans | 97.2 /100 | #108 | Exceptional $90,618 |
| Chileans | 97.2 /100 | #109 | Exceptional $90,605 |
| Palestinians | 97.1 /100 | #110 | Exceptional $90,574 |
| Immigrants | Poland | 97.1 /100 | #111 | Exceptional $90,549 |
| Northern Europeans | 96.9 /100 | #112 | Exceptional $90,446 |
| Peruvians | 96.5 /100 | #113 | Exceptional $90,261 |
| Immigrants | Northern Africa | 95.9 /100 | #114 | Exceptional $90,026 |
| Immigrants | Western Asia | 95.9 /100 | #115 | Exceptional $90,005 |