Yup'ik vs Immigrants from Moldova Median Household Income
COMPARE
Yup'ik
Immigrants from Moldova
Median Household Income
Median Household Income Comparison
Yup'ik
Immigrants from Moldova
$69,695
MEDIAN HOUSEHOLD INCOME
0.0/ 100
METRIC RATING
324th/ 347
METRIC RANK
$91,446
MEDIAN HOUSEHOLD INCOME
98.3/ 100
METRIC RATING
101st/ 347
METRIC RANK
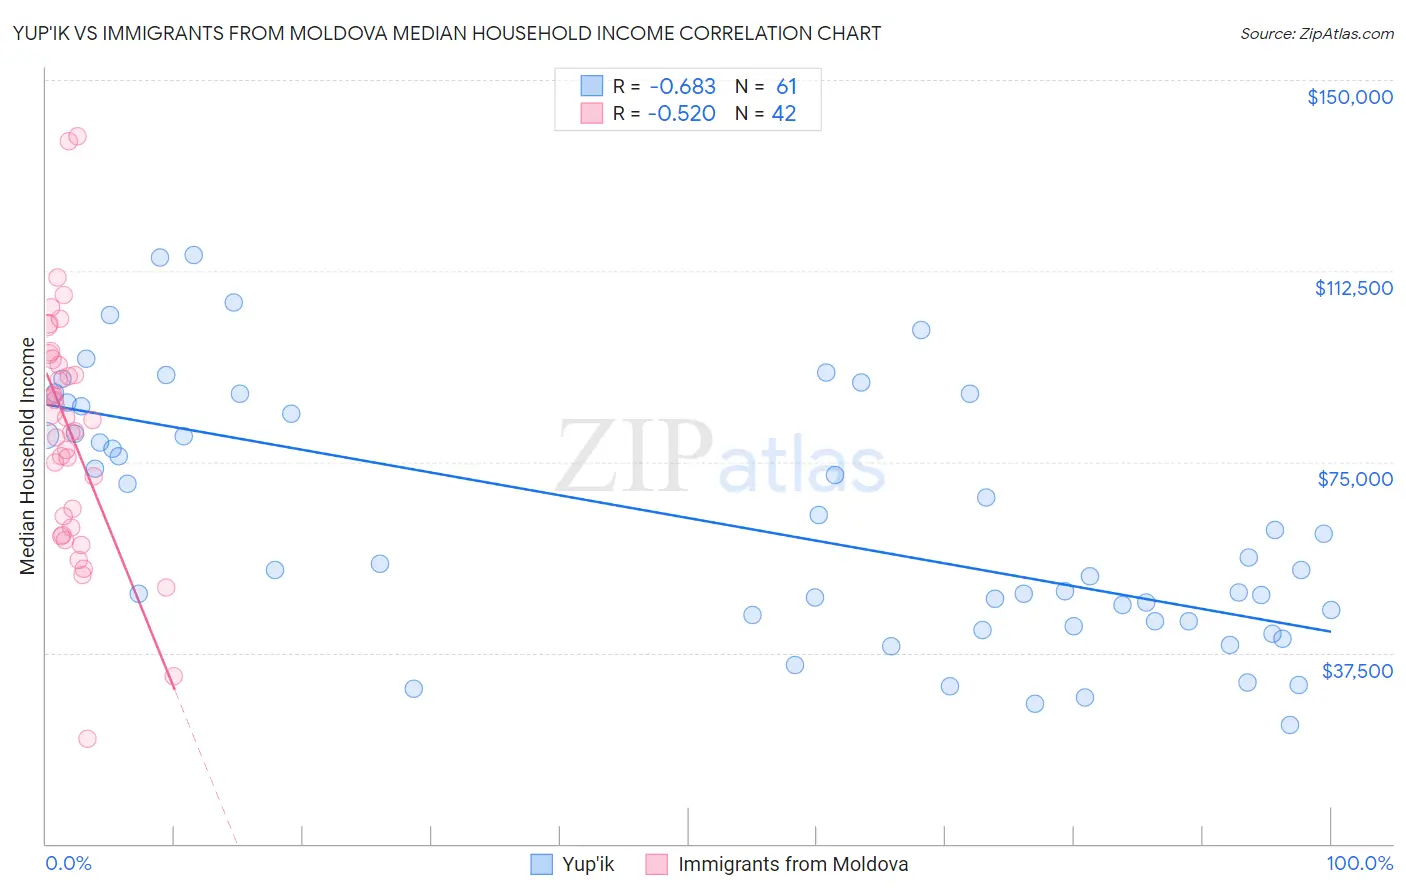
Yup'ik vs Immigrants from Moldova Median Household Income Correlation Chart
The statistical analysis conducted on geographies consisting of 39,952,449 people shows a significant negative correlation between the proportion of Yup'ik and median household income in the United States with a correlation coefficient (R) of -0.683 and weighted average of $69,695. Similarly, the statistical analysis conducted on geographies consisting of 124,363,535 people shows a substantial negative correlation between the proportion of Immigrants from Moldova and median household income in the United States with a correlation coefficient (R) of -0.520 and weighted average of $91,446, a difference of 31.2%.
Median Household Income Correlation Summary
| Measurement | Yup'ik | Immigrants from Moldova |
| Minimum | $23,333 | $20,699 |
| Maximum | $115,625 | $138,879 |
| Range | $92,292 | $118,180 |
| Mean | $62,948 | $80,883 |
| Median | $55,000 | $82,096 |
| Interquartile 25% (IQ1) | $43,673 | $62,083 |
| Interquartile 75% (IQ3) | $85,198 | $95,143 |
| Interquartile Range (IQR) | $41,525 | $33,060 |
| Standard Deviation (Sample) | $24,365 | $23,912 |
| Standard Deviation (Population) | $24,165 | $23,626 |
Similar Demographics by Median Household Income
Demographics Similar to Yup'ik by Median Household Income
In terms of median household income, the demographic groups most similar to Yup'ik are Bahamian ($69,726, a difference of 0.040%), Choctaw ($69,947, a difference of 0.36%), Seminole ($69,420, a difference of 0.40%), Chickasaw ($70,005, a difference of 0.45%), and Colville ($70,094, a difference of 0.57%).
| Demographics | Rating | Rank | Median Household Income |
| Cajuns | 0.0 /100 | #317 | Tragic $70,605 |
| Chippewa | 0.0 /100 | #318 | Tragic $70,539 |
| Immigrants | Dominican Republic | 0.0 /100 | #319 | Tragic $70,208 |
| Colville | 0.0 /100 | #320 | Tragic $70,094 |
| Chickasaw | 0.0 /100 | #321 | Tragic $70,005 |
| Choctaw | 0.0 /100 | #322 | Tragic $69,947 |
| Bahamians | 0.0 /100 | #323 | Tragic $69,726 |
| Yup'ik | 0.0 /100 | #324 | Tragic $69,695 |
| Seminole | 0.0 /100 | #325 | Tragic $69,420 |
| Yuman | 0.0 /100 | #326 | Tragic $68,743 |
| Immigrants | Cuba | 0.0 /100 | #327 | Tragic $68,461 |
| Menominee | 0.0 /100 | #328 | Tragic $68,423 |
| Dutch West Indians | 0.0 /100 | #329 | Tragic $68,412 |
| Arapaho | 0.0 /100 | #330 | Tragic $67,965 |
| Natives/Alaskans | 0.0 /100 | #331 | Tragic $67,879 |
Demographics Similar to Immigrants from Moldova by Median Household Income
In terms of median household income, the demographic groups most similar to Immigrants from Moldova are Ukrainian ($91,456, a difference of 0.010%), Immigrants from South Eastern Asia ($91,541, a difference of 0.10%), Austrian ($91,339, a difference of 0.12%), Immigrants from Southern Europe ($91,605, a difference of 0.17%), and Immigrants from Serbia ($91,730, a difference of 0.31%).
| Demographics | Rating | Rank | Median Household Income |
| Immigrants | North America | 98.7 /100 | #94 | Exceptional $91,860 |
| Armenians | 98.7 /100 | #95 | Exceptional $91,807 |
| Jordanians | 98.7 /100 | #96 | Exceptional $91,794 |
| Immigrants | Serbia | 98.6 /100 | #97 | Exceptional $91,730 |
| Immigrants | Southern Europe | 98.5 /100 | #98 | Exceptional $91,605 |
| Immigrants | South Eastern Asia | 98.4 /100 | #99 | Exceptional $91,541 |
| Ukrainians | 98.3 /100 | #100 | Exceptional $91,456 |
| Immigrants | Moldova | 98.3 /100 | #101 | Exceptional $91,446 |
| Austrians | 98.2 /100 | #102 | Exceptional $91,339 |
| Immigrants | Ukraine | 98.0 /100 | #103 | Exceptional $91,124 |
| Immigrants | Kazakhstan | 97.8 /100 | #104 | Exceptional $91,015 |
| Immigrants | Brazil | 97.7 /100 | #105 | Exceptional $90,907 |
| Macedonians | 97.4 /100 | #106 | Exceptional $90,761 |
| Croatians | 97.3 /100 | #107 | Exceptional $90,685 |
| Zimbabweans | 97.2 /100 | #108 | Exceptional $90,618 |