Palestinian vs Immigrants from Moldova Disability Age 35 to 64
COMPARE
Palestinian
Immigrants from Moldova
Disability Age 35 to 64
Disability Age 35 to 64 Comparison
Palestinians
Immigrants from Moldova
10.4%
DISABILITY AGE 35 TO 64
98.2/ 100
METRIC RATING
99th/ 347
METRIC RANK
10.6%
DISABILITY AGE 35 TO 64
95.5/ 100
METRIC RATING
118th/ 347
METRIC RANK
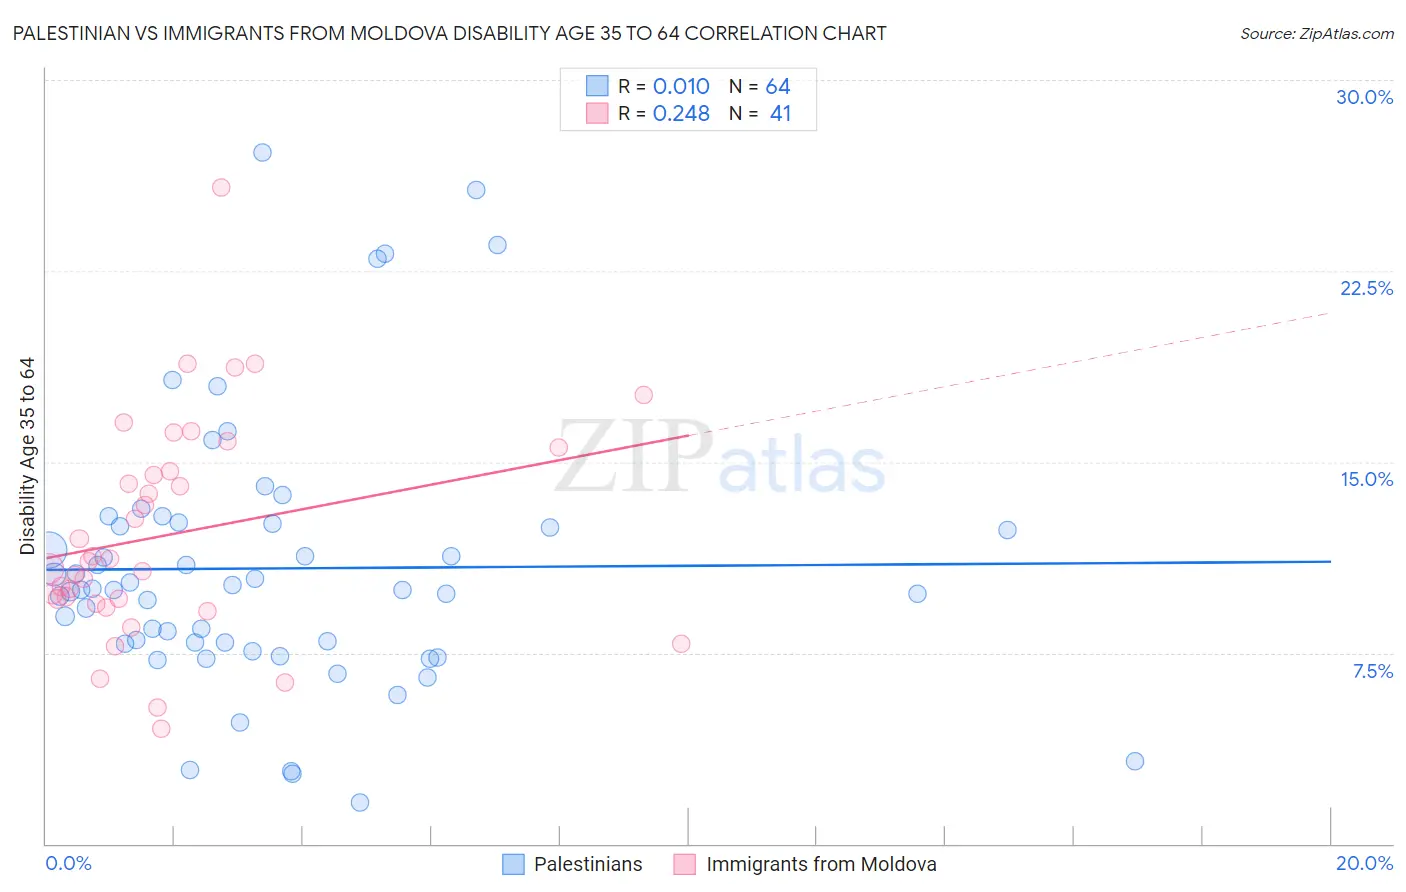
Palestinian vs Immigrants from Moldova Disability Age 35 to 64 Correlation Chart
The statistical analysis conducted on geographies consisting of 216,388,113 people shows no correlation between the proportion of Palestinians and percentage of population with a disability between the ages 34 and 64 in the United States with a correlation coefficient (R) of 0.010 and weighted average of 10.4%. Similarly, the statistical analysis conducted on geographies consisting of 124,364,571 people shows a weak positive correlation between the proportion of Immigrants from Moldova and percentage of population with a disability between the ages 34 and 64 in the United States with a correlation coefficient (R) of 0.248 and weighted average of 10.6%, a difference of 2.1%.
Disability Age 35 to 64 Correlation Summary
| Measurement | Palestinian | Immigrants from Moldova |
| Minimum | 1.6% | 4.5% |
| Maximum | 27.2% | 25.8% |
| Range | 25.5% | 21.2% |
| Mean | 10.8% | 12.2% |
| Median | 10.0% | 11.1% |
| Interquartile 25% (IQ1) | 7.9% | 9.5% |
| Interquartile 75% (IQ3) | 12.5% | 15.1% |
| Interquartile Range (IQR) | 4.6% | 5.6% |
| Standard Deviation (Sample) | 5.3% | 4.3% |
| Standard Deviation (Population) | 5.2% | 4.3% |
Demographics Similar to Palestinians and Immigrants from Moldova by Disability Age 35 to 64
In terms of disability age 35 to 64, the demographic groups most similar to Palestinians are Immigrants from Uruguay (10.3%, a difference of 0.13%), Immigrants from Jordan (10.4%, a difference of 0.22%), Immigrants from Philippines (10.4%, a difference of 0.27%), Immigrants from Western Asia (10.4%, a difference of 0.33%), and Immigrants from Ukraine (10.4%, a difference of 0.36%). Similarly, the demographic groups most similar to Immigrants from Moldova are Immigrants from South Eastern Asia (10.6%, a difference of 0.090%), Immigrants from Nepal (10.6%, a difference of 0.19%), Immigrants from Netherlands (10.5%, a difference of 0.42%), Immigrants from Morocco (10.5%, a difference of 0.59%), and Tongan (10.5%, a difference of 0.64%).
| Demographics | Rating | Rank | Disability Age 35 to 64 |
| Immigrants | Uruguay | 98.3 /100 | #98 | Exceptional 10.3% |
| Palestinians | 98.2 /100 | #99 | Exceptional 10.4% |
| Immigrants | Jordan | 98.1 /100 | #100 | Exceptional 10.4% |
| Immigrants | Philippines | 98.0 /100 | #101 | Exceptional 10.4% |
| Immigrants | Western Asia | 98.0 /100 | #102 | Exceptional 10.4% |
| Immigrants | Ukraine | 97.9 /100 | #103 | Exceptional 10.4% |
| Immigrants | Austria | 97.8 /100 | #104 | Exceptional 10.4% |
| Macedonians | 97.8 /100 | #105 | Exceptional 10.4% |
| Immigrants | Hungary | 97.6 /100 | #106 | Exceptional 10.4% |
| Zimbabweans | 97.4 /100 | #107 | Exceptional 10.4% |
| Ethiopians | 97.4 /100 | #108 | Exceptional 10.5% |
| Immigrants | Ethiopia | 97.2 /100 | #109 | Exceptional 10.5% |
| Koreans | 97.1 /100 | #110 | Exceptional 10.5% |
| Brazilians | 96.9 /100 | #111 | Exceptional 10.5% |
| Assyrians/Chaldeans/Syriacs | 96.8 /100 | #112 | Exceptional 10.5% |
| Tongans | 96.6 /100 | #113 | Exceptional 10.5% |
| Immigrants | Morocco | 96.6 /100 | #114 | Exceptional 10.5% |
| Immigrants | Netherlands | 96.3 /100 | #115 | Exceptional 10.5% |
| Immigrants | Nepal | 95.9 /100 | #116 | Exceptional 10.6% |
| Immigrants | South Eastern Asia | 95.7 /100 | #117 | Exceptional 10.6% |
| Immigrants | Moldova | 95.5 /100 | #118 | Exceptional 10.6% |