Palestinian vs White/Caucasian Median Household Income
COMPARE
Palestinian
White/Caucasian
Median Household Income
Median Household Income Comparison
Palestinians
Whites/Caucasians
$90,574
MEDIAN HOUSEHOLD INCOME
97.1/ 100
METRIC RATING
110th/ 347
METRIC RANK
$82,029
MEDIAN HOUSEHOLD INCOME
12.2/ 100
METRIC RATING
218th/ 347
METRIC RANK
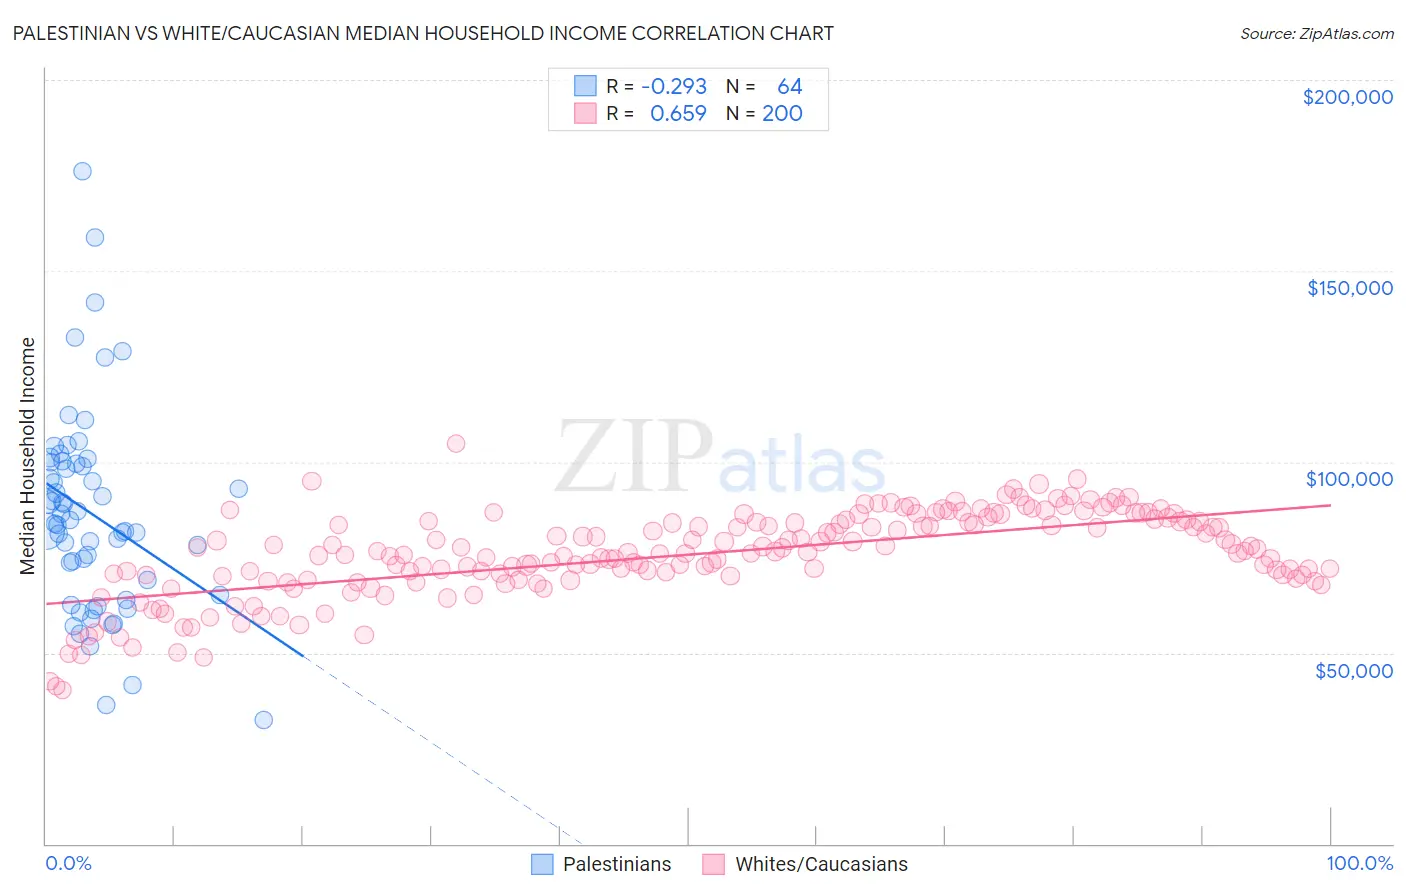
Palestinian vs White/Caucasian Median Household Income Correlation Chart
The statistical analysis conducted on geographies consisting of 216,355,198 people shows a weak negative correlation between the proportion of Palestinians and median household income in the United States with a correlation coefficient (R) of -0.293 and weighted average of $90,574. Similarly, the statistical analysis conducted on geographies consisting of 583,274,044 people shows a significant positive correlation between the proportion of Whites/Caucasians and median household income in the United States with a correlation coefficient (R) of 0.659 and weighted average of $82,029, a difference of 10.4%.
Median Household Income Correlation Summary
| Measurement | Palestinian | White/Caucasian |
| Minimum | $32,375 | $40,196 |
| Maximum | $176,058 | $104,886 |
| Range | $143,683 | $64,690 |
| Mean | $86,299 | $75,721 |
| Median | $84,304 | $76,251 |
| Interquartile 25% (IQ1) | $67,018 | $70,055 |
| Interquartile 75% (IQ3) | $99,711 | $84,369 |
| Interquartile Range (IQR) | $32,693 | $14,314 |
| Standard Deviation (Sample) | $26,509 | $11,326 |
| Standard Deviation (Population) | $26,301 | $11,297 |
Similar Demographics by Median Household Income
Demographics Similar to Palestinians by Median Household Income
In terms of median household income, the demographic groups most similar to Palestinians are Chilean ($90,605, a difference of 0.030%), Immigrants from Poland ($90,549, a difference of 0.030%), Zimbabwean ($90,618, a difference of 0.050%), Croatian ($90,685, a difference of 0.12%), and Northern European ($90,446, a difference of 0.14%).
| Demographics | Rating | Rank | Median Household Income |
| Immigrants | Ukraine | 98.0 /100 | #103 | Exceptional $91,124 |
| Immigrants | Kazakhstan | 97.8 /100 | #104 | Exceptional $91,015 |
| Immigrants | Brazil | 97.7 /100 | #105 | Exceptional $90,907 |
| Macedonians | 97.4 /100 | #106 | Exceptional $90,761 |
| Croatians | 97.3 /100 | #107 | Exceptional $90,685 |
| Zimbabweans | 97.2 /100 | #108 | Exceptional $90,618 |
| Chileans | 97.2 /100 | #109 | Exceptional $90,605 |
| Palestinians | 97.1 /100 | #110 | Exceptional $90,574 |
| Immigrants | Poland | 97.1 /100 | #111 | Exceptional $90,549 |
| Northern Europeans | 96.9 /100 | #112 | Exceptional $90,446 |
| Peruvians | 96.5 /100 | #113 | Exceptional $90,261 |
| Immigrants | Northern Africa | 95.9 /100 | #114 | Exceptional $90,026 |
| Immigrants | Western Asia | 95.9 /100 | #115 | Exceptional $90,005 |
| Native Hawaiians | 95.7 /100 | #116 | Exceptional $89,919 |
| Taiwanese | 95.6 /100 | #117 | Exceptional $89,900 |
Demographics Similar to Whites/Caucasians by Median Household Income
In terms of median household income, the demographic groups most similar to Whites/Caucasians are Ecuadorian ($82,070, a difference of 0.050%), Yugoslavian ($82,186, a difference of 0.19%), Vietnamese ($82,248, a difference of 0.27%), Panamanian ($82,272, a difference of 0.30%), and Nigerian ($81,725, a difference of 0.37%).
| Demographics | Rating | Rank | Median Household Income |
| Salvadorans | 15.4 /100 | #211 | Poor $82,449 |
| Venezuelans | 15.3 /100 | #212 | Poor $82,432 |
| Nepalese | 15.1 /100 | #213 | Poor $82,410 |
| Panamanians | 14.0 /100 | #214 | Poor $82,272 |
| Vietnamese | 13.8 /100 | #215 | Poor $82,248 |
| Yugoslavians | 13.3 /100 | #216 | Poor $82,186 |
| Ecuadorians | 12.5 /100 | #217 | Poor $82,070 |
| Whites/Caucasians | 12.2 /100 | #218 | Poor $82,029 |
| Nigerians | 10.3 /100 | #219 | Poor $81,725 |
| Immigrants | Venezuela | 9.0 /100 | #220 | Tragic $81,506 |
| Immigrants | Ghana | 9.0 /100 | #221 | Tragic $81,489 |
| Immigrants | Nigeria | 7.7 /100 | #222 | Tragic $81,236 |
| Immigrants | El Salvador | 7.6 /100 | #223 | Tragic $81,213 |
| Malaysians | 7.0 /100 | #224 | Tragic $81,064 |
| Scotch-Irish | 6.6 /100 | #225 | Tragic $80,972 |