Palestinian vs Immigrants from Moldova Householder Income Ages 25 - 44 years
COMPARE
Palestinian
Immigrants from Moldova
Householder Income Ages 25 - 44 years
Householder Income Ages 25 - 44 years Comparison
Palestinians
Immigrants from Moldova
$98,777
HOUSEHOLDER INCOME AGES 25 - 44 YEARS
91.2/ 100
METRIC RATING
123rd/ 347
METRIC RANK
$101,091
HOUSEHOLDER INCOME AGES 25 - 44 YEARS
97.4/ 100
METRIC RATING
103rd/ 347
METRIC RANK
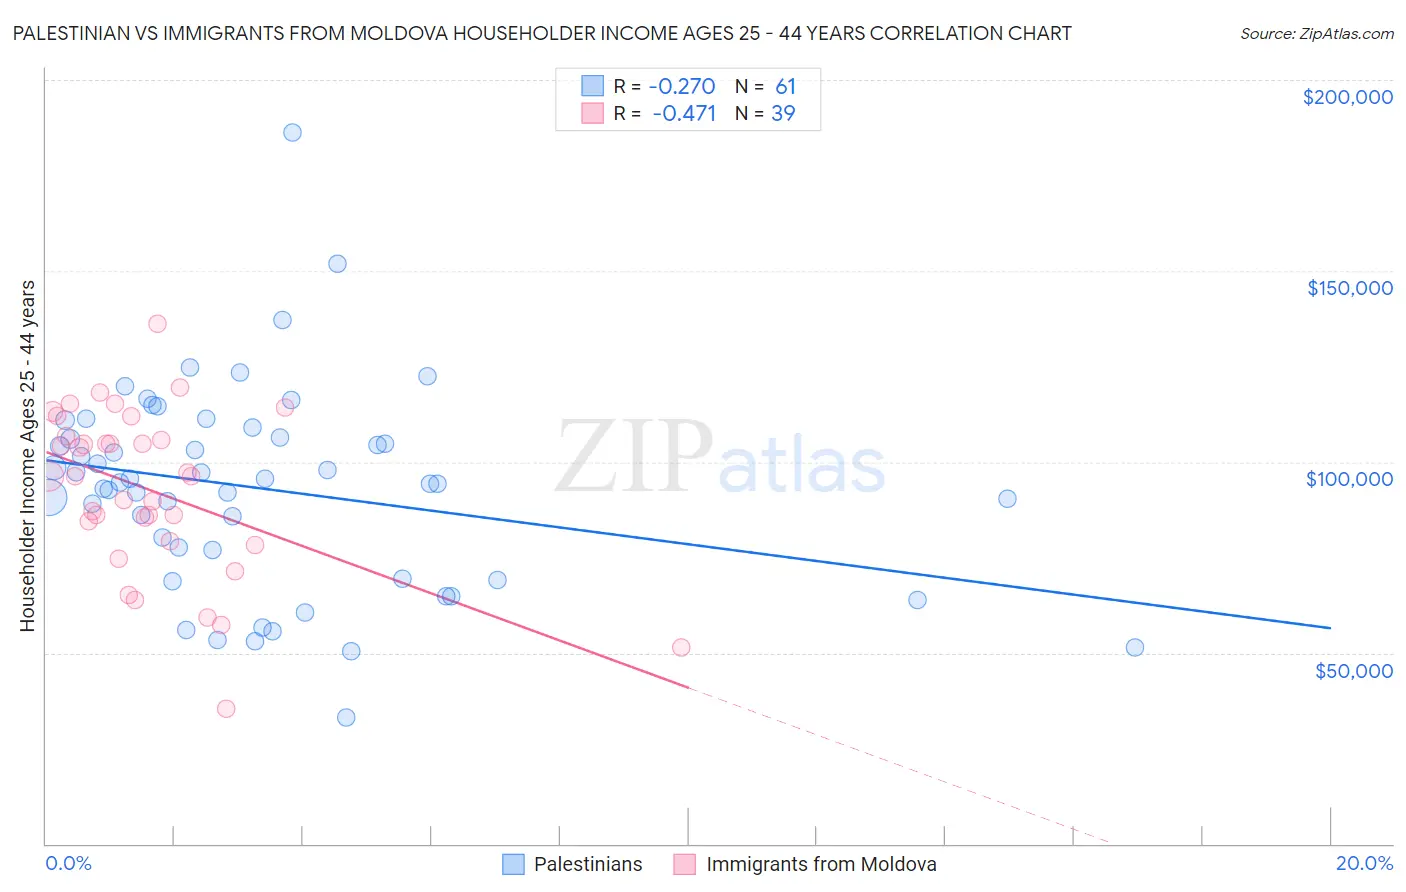
Palestinian vs Immigrants from Moldova Householder Income Ages 25 - 44 years Correlation Chart
The statistical analysis conducted on geographies consisting of 216,290,532 people shows a weak negative correlation between the proportion of Palestinians and household income with householder between the ages 25 and 44 in the United States with a correlation coefficient (R) of -0.270 and weighted average of $98,777. Similarly, the statistical analysis conducted on geographies consisting of 124,290,289 people shows a moderate negative correlation between the proportion of Immigrants from Moldova and household income with householder between the ages 25 and 44 in the United States with a correlation coefficient (R) of -0.471 and weighted average of $101,091, a difference of 2.3%.
Householder Income Ages 25 - 44 years Correlation Summary
| Measurement | Palestinian | Immigrants from Moldova |
| Minimum | $33,077 | $35,313 |
| Maximum | $186,111 | $136,071 |
| Range | $153,034 | $100,758 |
| Mean | $93,023 | $92,583 |
| Median | $94,675 | $96,188 |
| Interquartile 25% (IQ1) | $73,167 | $79,269 |
| Interquartile 75% (IQ3) | $107,616 | $106,700 |
| Interquartile Range (IQR) | $34,449 | $27,431 |
| Standard Deviation (Sample) | $26,611 | $21,518 |
| Standard Deviation (Population) | $26,392 | $21,240 |
Demographics Similar to Palestinians and Immigrants from Moldova by Householder Income Ages 25 - 44 years
In terms of householder income ages 25 - 44 years, the demographic groups most similar to Palestinians are Immigrants from Uzbekistan ($98,849, a difference of 0.070%), Peruvian ($98,886, a difference of 0.11%), Swedish ($99,136, a difference of 0.36%), Jordanian ($99,186, a difference of 0.41%), and Syrian ($99,215, a difference of 0.44%). Similarly, the demographic groups most similar to Immigrants from Moldova are Immigrants from Poland ($101,065, a difference of 0.030%), Immigrants from Vietnam ($100,535, a difference of 0.55%), Immigrants from Brazil ($100,534, a difference of 0.55%), Northern European ($100,457, a difference of 0.63%), and Immigrants from South Eastern Asia ($100,283, a difference of 0.81%).
| Demographics | Rating | Rank | Householder Income Ages 25 - 44 years |
| Immigrants | Moldova | 97.4 /100 | #103 | Exceptional $101,091 |
| Immigrants | Poland | 97.4 /100 | #104 | Exceptional $101,065 |
| Immigrants | Vietnam | 96.5 /100 | #105 | Exceptional $100,535 |
| Immigrants | Brazil | 96.5 /100 | #106 | Exceptional $100,534 |
| Northern Europeans | 96.3 /100 | #107 | Exceptional $100,457 |
| Immigrants | South Eastern Asia | 96.0 /100 | #108 | Exceptional $100,283 |
| Immigrants | North Macedonia | 95.6 /100 | #109 | Exceptional $100,101 |
| Immigrants | Afghanistan | 95.3 /100 | #110 | Exceptional $99,977 |
| Chileans | 95.1 /100 | #111 | Exceptional $99,900 |
| Poles | 94.5 /100 | #112 | Exceptional $99,685 |
| Tongans | 94.2 /100 | #113 | Exceptional $99,604 |
| Immigrants | Western Asia | 94.0 /100 | #114 | Exceptional $99,516 |
| Carpatho Rusyns | 93.7 /100 | #115 | Exceptional $99,449 |
| Portuguese | 93.7 /100 | #116 | Exceptional $99,429 |
| Immigrants | Northern Africa | 93.0 /100 | #117 | Exceptional $99,232 |
| Syrians | 92.9 /100 | #118 | Exceptional $99,215 |
| Jordanians | 92.8 /100 | #119 | Exceptional $99,186 |
| Swedes | 92.7 /100 | #120 | Exceptional $99,136 |
| Peruvians | 91.7 /100 | #121 | Exceptional $98,886 |
| Immigrants | Uzbekistan | 91.5 /100 | #122 | Exceptional $98,849 |
| Palestinians | 91.2 /100 | #123 | Exceptional $98,777 |