Palestinian vs Immigrants from Haiti Median Household Income
COMPARE
Palestinian
Immigrants from Haiti
Median Household Income
Median Household Income Comparison
Palestinians
Immigrants from Haiti
$90,574
MEDIAN HOUSEHOLD INCOME
97.1/ 100
METRIC RATING
110th/ 347
METRIC RANK
$72,599
MEDIAN HOUSEHOLD INCOME
0.0/ 100
METRIC RATING
304th/ 347
METRIC RANK
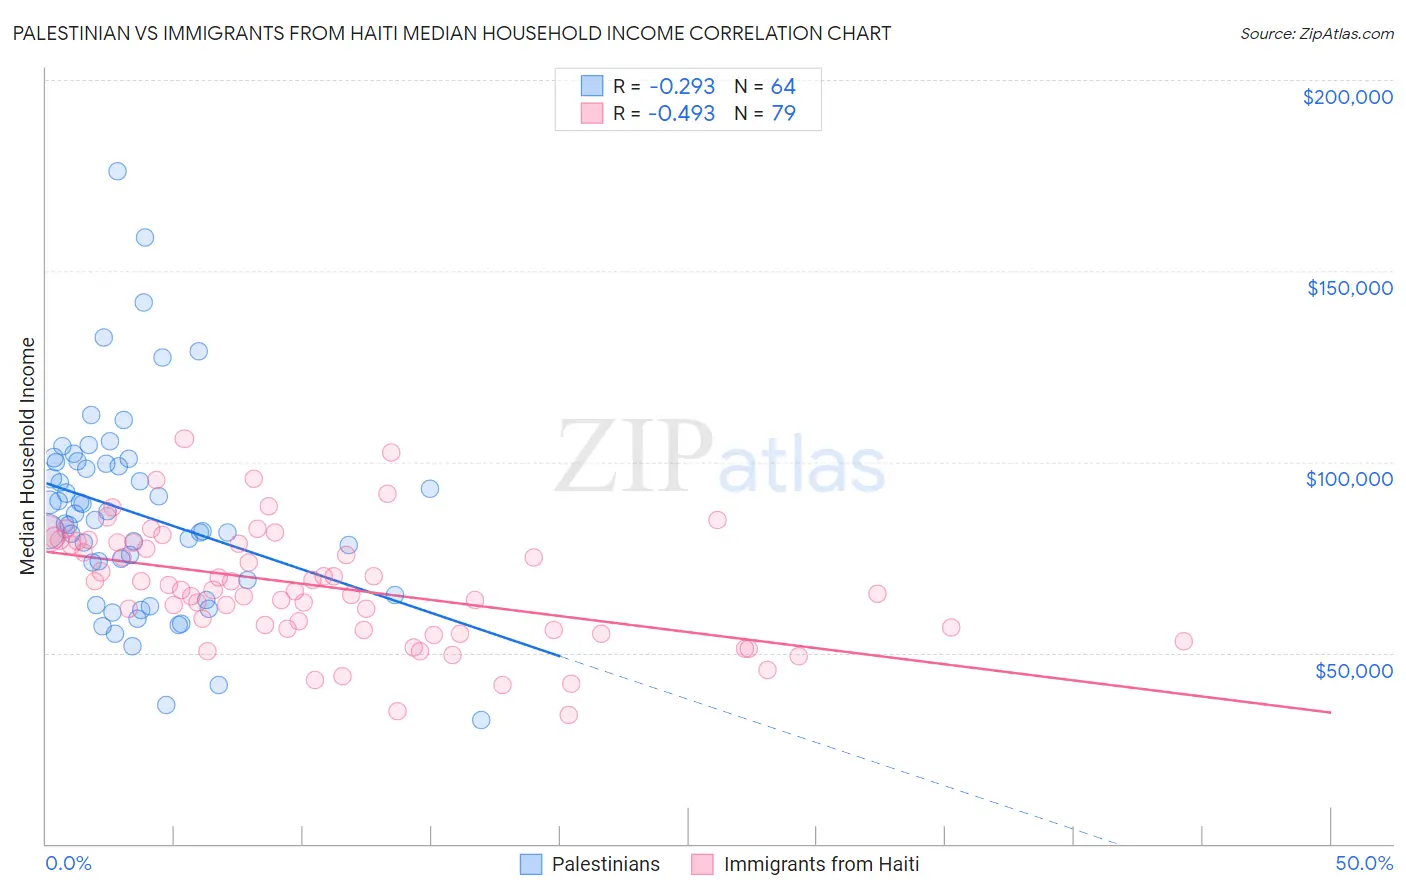
Palestinian vs Immigrants from Haiti Median Household Income Correlation Chart
The statistical analysis conducted on geographies consisting of 216,355,198 people shows a weak negative correlation between the proportion of Palestinians and median household income in the United States with a correlation coefficient (R) of -0.293 and weighted average of $90,574. Similarly, the statistical analysis conducted on geographies consisting of 225,133,235 people shows a moderate negative correlation between the proportion of Immigrants from Haiti and median household income in the United States with a correlation coefficient (R) of -0.493 and weighted average of $72,599, a difference of 24.8%.
Median Household Income Correlation Summary
| Measurement | Palestinian | Immigrants from Haiti |
| Minimum | $32,375 | $33,629 |
| Maximum | $176,058 | $105,986 |
| Range | $143,683 | $72,357 |
| Mean | $86,299 | $67,399 |
| Median | $84,304 | $66,369 |
| Interquartile 25% (IQ1) | $67,018 | $56,044 |
| Interquartile 75% (IQ3) | $99,711 | $78,973 |
| Interquartile Range (IQR) | $32,693 | $22,929 |
| Standard Deviation (Sample) | $26,509 | $15,193 |
| Standard Deviation (Population) | $26,301 | $15,096 |
Similar Demographics by Median Household Income
Demographics Similar to Palestinians by Median Household Income
In terms of median household income, the demographic groups most similar to Palestinians are Chilean ($90,605, a difference of 0.030%), Immigrants from Poland ($90,549, a difference of 0.030%), Zimbabwean ($90,618, a difference of 0.050%), Croatian ($90,685, a difference of 0.12%), and Northern European ($90,446, a difference of 0.14%).
| Demographics | Rating | Rank | Median Household Income |
| Immigrants | Ukraine | 98.0 /100 | #103 | Exceptional $91,124 |
| Immigrants | Kazakhstan | 97.8 /100 | #104 | Exceptional $91,015 |
| Immigrants | Brazil | 97.7 /100 | #105 | Exceptional $90,907 |
| Macedonians | 97.4 /100 | #106 | Exceptional $90,761 |
| Croatians | 97.3 /100 | #107 | Exceptional $90,685 |
| Zimbabweans | 97.2 /100 | #108 | Exceptional $90,618 |
| Chileans | 97.2 /100 | #109 | Exceptional $90,605 |
| Palestinians | 97.1 /100 | #110 | Exceptional $90,574 |
| Immigrants | Poland | 97.1 /100 | #111 | Exceptional $90,549 |
| Northern Europeans | 96.9 /100 | #112 | Exceptional $90,446 |
| Peruvians | 96.5 /100 | #113 | Exceptional $90,261 |
| Immigrants | Northern Africa | 95.9 /100 | #114 | Exceptional $90,026 |
| Immigrants | Western Asia | 95.9 /100 | #115 | Exceptional $90,005 |
| Native Hawaiians | 95.7 /100 | #116 | Exceptional $89,919 |
| Taiwanese | 95.6 /100 | #117 | Exceptional $89,900 |
Demographics Similar to Immigrants from Haiti by Median Household Income
In terms of median household income, the demographic groups most similar to Immigrants from Haiti are Honduran ($72,588, a difference of 0.020%), Potawatomi ($72,576, a difference of 0.030%), African ($72,650, a difference of 0.070%), Shoshone ($72,660, a difference of 0.080%), and Cherokee ($72,682, a difference of 0.11%).
| Demographics | Rating | Rank | Median Household Income |
| Immigrants | Mexico | 0.0 /100 | #297 | Tragic $73,160 |
| Paiute | 0.0 /100 | #298 | Tragic $72,959 |
| Indonesians | 0.0 /100 | #299 | Tragic $72,856 |
| Immigrants | Dominica | 0.0 /100 | #300 | Tragic $72,760 |
| Cherokee | 0.0 /100 | #301 | Tragic $72,682 |
| Shoshone | 0.0 /100 | #302 | Tragic $72,660 |
| Africans | 0.0 /100 | #303 | Tragic $72,650 |
| Immigrants | Haiti | 0.0 /100 | #304 | Tragic $72,599 |
| Hondurans | 0.0 /100 | #305 | Tragic $72,588 |
| Potawatomi | 0.0 /100 | #306 | Tragic $72,576 |
| Ute | 0.0 /100 | #307 | Tragic $72,402 |
| Yakama | 0.0 /100 | #308 | Tragic $72,225 |
| Immigrants | Caribbean | 0.0 /100 | #309 | Tragic $71,860 |
| U.S. Virgin Islanders | 0.0 /100 | #310 | Tragic $71,853 |
| Immigrants | Zaire | 0.0 /100 | #311 | Tragic $71,801 |