Palestinian vs Immigrants from Western Asia Median Household Income
COMPARE
Palestinian
Immigrants from Western Asia
Median Household Income
Median Household Income Comparison
Palestinians
Immigrants from Western Asia
$90,574
MEDIAN HOUSEHOLD INCOME
97.1/ 100
METRIC RATING
110th/ 347
METRIC RANK
$90,005
MEDIAN HOUSEHOLD INCOME
95.9/ 100
METRIC RATING
115th/ 347
METRIC RANK
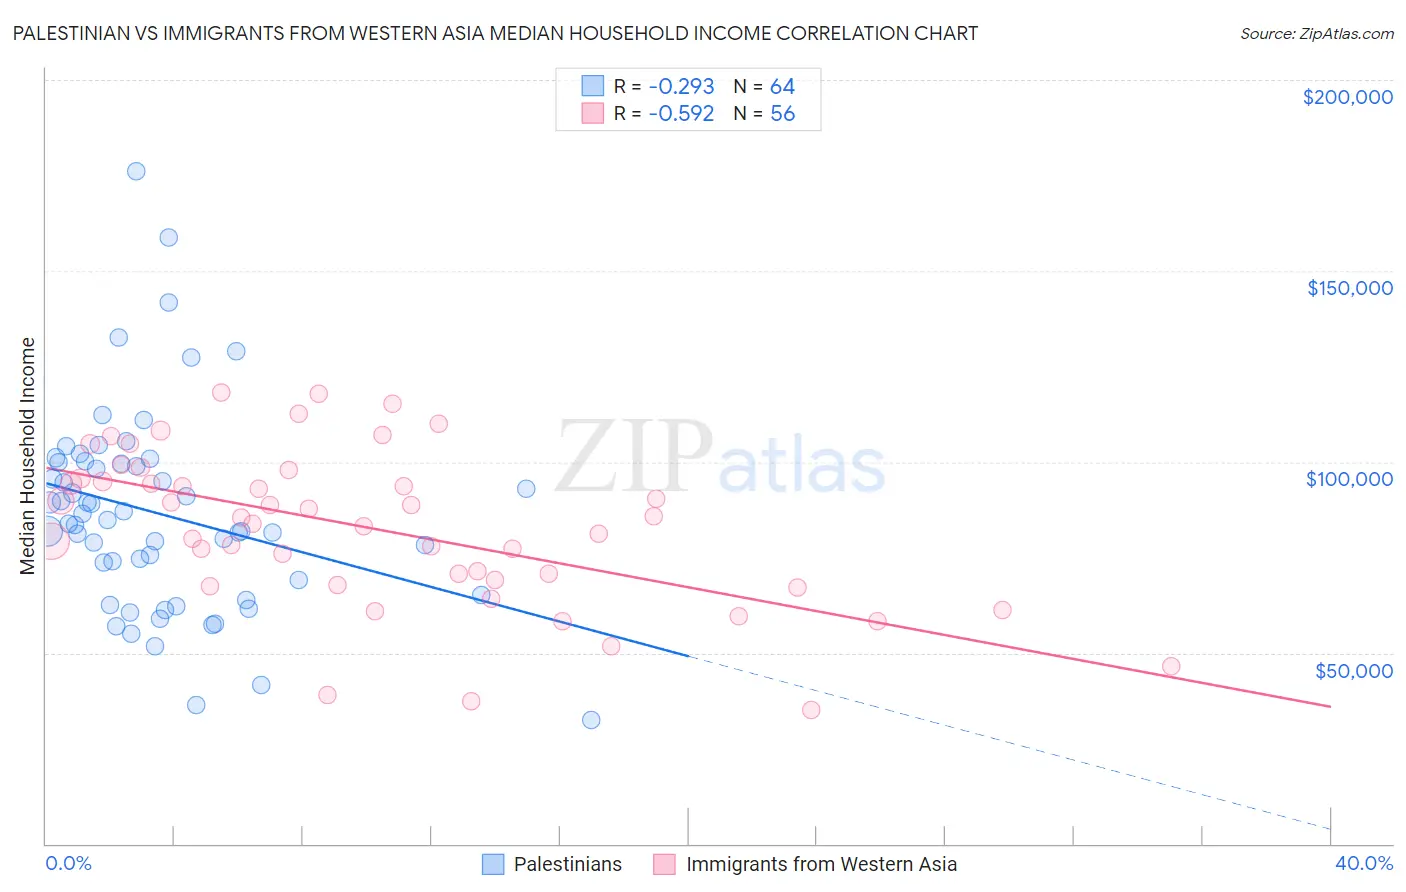
Palestinian vs Immigrants from Western Asia Median Household Income Correlation Chart
The statistical analysis conducted on geographies consisting of 216,355,198 people shows a weak negative correlation between the proportion of Palestinians and median household income in the United States with a correlation coefficient (R) of -0.293 and weighted average of $90,574. Similarly, the statistical analysis conducted on geographies consisting of 404,096,096 people shows a substantial negative correlation between the proportion of Immigrants from Western Asia and median household income in the United States with a correlation coefficient (R) of -0.592 and weighted average of $90,005, a difference of 0.63%.
Median Household Income Correlation Summary
| Measurement | Palestinian | Immigrants from Western Asia |
| Minimum | $32,375 | $35,078 |
| Maximum | $176,058 | $118,185 |
| Range | $143,683 | $83,107 |
| Mean | $86,299 | $82,428 |
| Median | $84,304 | $84,634 |
| Interquartile 25% (IQ1) | $67,018 | $68,360 |
| Interquartile 75% (IQ3) | $99,711 | $95,239 |
| Interquartile Range (IQR) | $32,693 | $26,880 |
| Standard Deviation (Sample) | $26,509 | $20,407 |
| Standard Deviation (Population) | $26,301 | $20,224 |
Demographics Similar to Palestinians and Immigrants from Western Asia by Median Household Income
In terms of median household income, the demographic groups most similar to Palestinians are Chilean ($90,605, a difference of 0.030%), Immigrants from Poland ($90,549, a difference of 0.030%), Zimbabwean ($90,618, a difference of 0.050%), Croatian ($90,685, a difference of 0.12%), and Northern European ($90,446, a difference of 0.14%). Similarly, the demographic groups most similar to Immigrants from Western Asia are Immigrants from Northern Africa ($90,026, a difference of 0.020%), Native Hawaiian ($89,919, a difference of 0.10%), Taiwanese ($89,900, a difference of 0.12%), Syrian ($89,830, a difference of 0.19%), and Peruvian ($90,261, a difference of 0.28%).
| Demographics | Rating | Rank | Median Household Income |
| Austrians | 98.2 /100 | #102 | Exceptional $91,339 |
| Immigrants | Ukraine | 98.0 /100 | #103 | Exceptional $91,124 |
| Immigrants | Kazakhstan | 97.8 /100 | #104 | Exceptional $91,015 |
| Immigrants | Brazil | 97.7 /100 | #105 | Exceptional $90,907 |
| Macedonians | 97.4 /100 | #106 | Exceptional $90,761 |
| Croatians | 97.3 /100 | #107 | Exceptional $90,685 |
| Zimbabweans | 97.2 /100 | #108 | Exceptional $90,618 |
| Chileans | 97.2 /100 | #109 | Exceptional $90,605 |
| Palestinians | 97.1 /100 | #110 | Exceptional $90,574 |
| Immigrants | Poland | 97.1 /100 | #111 | Exceptional $90,549 |
| Northern Europeans | 96.9 /100 | #112 | Exceptional $90,446 |
| Peruvians | 96.5 /100 | #113 | Exceptional $90,261 |
| Immigrants | Northern Africa | 95.9 /100 | #114 | Exceptional $90,026 |
| Immigrants | Western Asia | 95.9 /100 | #115 | Exceptional $90,005 |
| Native Hawaiians | 95.7 /100 | #116 | Exceptional $89,919 |
| Taiwanese | 95.6 /100 | #117 | Exceptional $89,900 |
| Syrians | 95.4 /100 | #118 | Exceptional $89,830 |
| Albanians | 95.2 /100 | #119 | Exceptional $89,744 |
| Immigrants | North Macedonia | 95.2 /100 | #120 | Exceptional $89,741 |
| Ethiopians | 94.9 /100 | #121 | Exceptional $89,640 |
| Pakistanis | 94.8 /100 | #122 | Exceptional $89,638 |