Palestinian vs Yuman Median Household Income
COMPARE
Palestinian
Yuman
Median Household Income
Median Household Income Comparison
Palestinians
Yuman
$90,574
MEDIAN HOUSEHOLD INCOME
97.1/ 100
METRIC RATING
110th/ 347
METRIC RANK
$68,743
MEDIAN HOUSEHOLD INCOME
0.0/ 100
METRIC RATING
326th/ 347
METRIC RANK
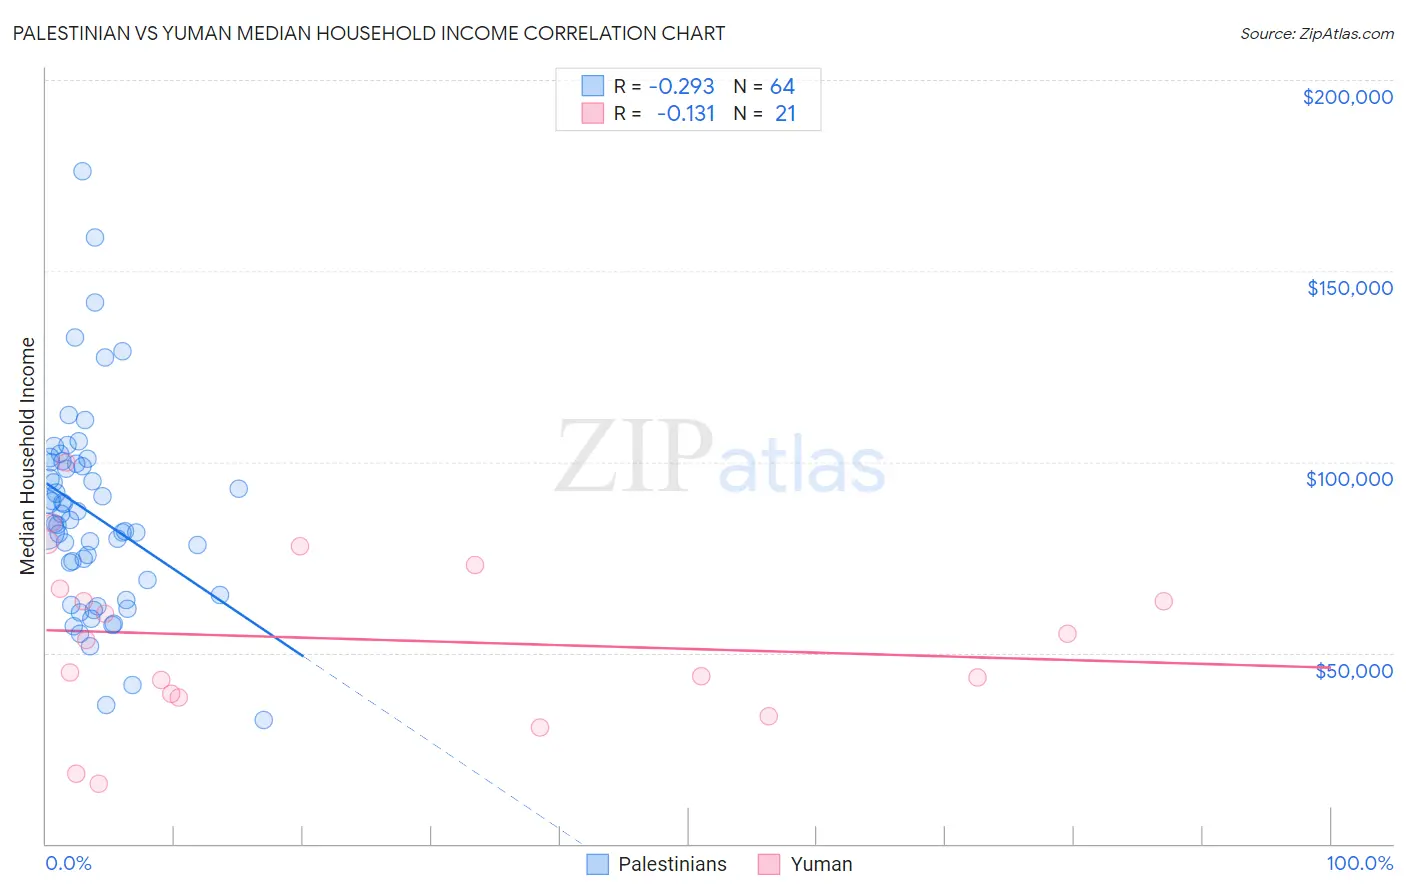
Palestinian vs Yuman Median Household Income Correlation Chart
The statistical analysis conducted on geographies consisting of 216,355,198 people shows a weak negative correlation between the proportion of Palestinians and median household income in the United States with a correlation coefficient (R) of -0.293 and weighted average of $90,574. Similarly, the statistical analysis conducted on geographies consisting of 40,662,869 people shows a poor negative correlation between the proportion of Yuman and median household income in the United States with a correlation coefficient (R) of -0.131 and weighted average of $68,743, a difference of 31.8%.
Median Household Income Correlation Summary
| Measurement | Palestinian | Yuman |
| Minimum | $32,375 | $15,625 |
| Maximum | $176,058 | $99,695 |
| Range | $143,683 | $84,070 |
| Mean | $86,299 | $53,635 |
| Median | $84,304 | $53,295 |
| Interquartile 25% (IQ1) | $67,018 | $38,762 |
| Interquartile 75% (IQ3) | $99,711 | $69,936 |
| Interquartile Range (IQR) | $32,693 | $31,174 |
| Standard Deviation (Sample) | $26,509 | $21,822 |
| Standard Deviation (Population) | $26,301 | $21,296 |
Similar Demographics by Median Household Income
Demographics Similar to Palestinians by Median Household Income
In terms of median household income, the demographic groups most similar to Palestinians are Chilean ($90,605, a difference of 0.030%), Immigrants from Poland ($90,549, a difference of 0.030%), Zimbabwean ($90,618, a difference of 0.050%), Croatian ($90,685, a difference of 0.12%), and Northern European ($90,446, a difference of 0.14%).
| Demographics | Rating | Rank | Median Household Income |
| Immigrants | Ukraine | 98.0 /100 | #103 | Exceptional $91,124 |
| Immigrants | Kazakhstan | 97.8 /100 | #104 | Exceptional $91,015 |
| Immigrants | Brazil | 97.7 /100 | #105 | Exceptional $90,907 |
| Macedonians | 97.4 /100 | #106 | Exceptional $90,761 |
| Croatians | 97.3 /100 | #107 | Exceptional $90,685 |
| Zimbabweans | 97.2 /100 | #108 | Exceptional $90,618 |
| Chileans | 97.2 /100 | #109 | Exceptional $90,605 |
| Palestinians | 97.1 /100 | #110 | Exceptional $90,574 |
| Immigrants | Poland | 97.1 /100 | #111 | Exceptional $90,549 |
| Northern Europeans | 96.9 /100 | #112 | Exceptional $90,446 |
| Peruvians | 96.5 /100 | #113 | Exceptional $90,261 |
| Immigrants | Northern Africa | 95.9 /100 | #114 | Exceptional $90,026 |
| Immigrants | Western Asia | 95.9 /100 | #115 | Exceptional $90,005 |
| Native Hawaiians | 95.7 /100 | #116 | Exceptional $89,919 |
| Taiwanese | 95.6 /100 | #117 | Exceptional $89,900 |
Demographics Similar to Yuman by Median Household Income
In terms of median household income, the demographic groups most similar to Yuman are Immigrants from Cuba ($68,461, a difference of 0.41%), Menominee ($68,423, a difference of 0.47%), Dutch West Indian ($68,412, a difference of 0.48%), Seminole ($69,420, a difference of 0.98%), and Arapaho ($67,965, a difference of 1.1%).
| Demographics | Rating | Rank | Median Household Income |
| Immigrants | Dominican Republic | 0.0 /100 | #319 | Tragic $70,208 |
| Colville | 0.0 /100 | #320 | Tragic $70,094 |
| Chickasaw | 0.0 /100 | #321 | Tragic $70,005 |
| Choctaw | 0.0 /100 | #322 | Tragic $69,947 |
| Bahamians | 0.0 /100 | #323 | Tragic $69,726 |
| Yup'ik | 0.0 /100 | #324 | Tragic $69,695 |
| Seminole | 0.0 /100 | #325 | Tragic $69,420 |
| Yuman | 0.0 /100 | #326 | Tragic $68,743 |
| Immigrants | Cuba | 0.0 /100 | #327 | Tragic $68,461 |
| Menominee | 0.0 /100 | #328 | Tragic $68,423 |
| Dutch West Indians | 0.0 /100 | #329 | Tragic $68,412 |
| Arapaho | 0.0 /100 | #330 | Tragic $67,965 |
| Natives/Alaskans | 0.0 /100 | #331 | Tragic $67,879 |
| Sioux | 0.0 /100 | #332 | Tragic $67,792 |
| Creek | 0.0 /100 | #333 | Tragic $67,715 |