Palestinian vs Immigrants from Moldova Associate's Degree
COMPARE
Palestinian
Immigrants from Moldova
Associate's Degree
Associate's Degree Comparison
Palestinians
Immigrants from Moldova
49.0%
ASSOCIATE'S DEGREE
95.3/ 100
METRIC RATING
113th/ 347
METRIC RANK
50.2%
ASSOCIATE'S DEGREE
98.8/ 100
METRIC RATING
87th/ 347
METRIC RANK
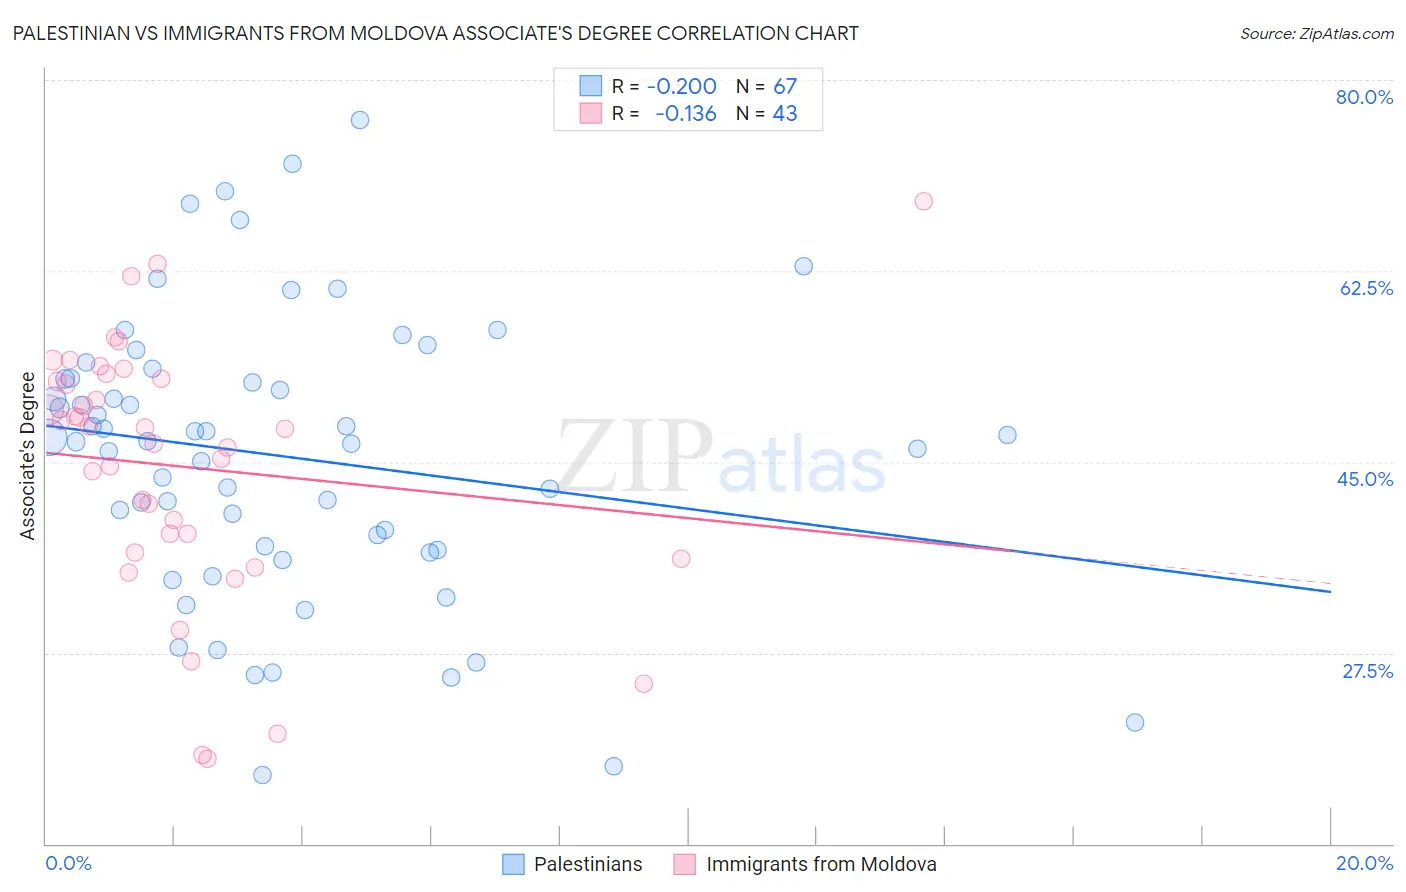
Palestinian vs Immigrants from Moldova Associate's Degree Correlation Chart
The statistical analysis conducted on geographies consisting of 216,454,143 people shows a weak negative correlation between the proportion of Palestinians and percentage of population with at least associate's degree education in the United States with a correlation coefficient (R) of -0.200 and weighted average of 49.0%. Similarly, the statistical analysis conducted on geographies consisting of 124,396,308 people shows a poor negative correlation between the proportion of Immigrants from Moldova and percentage of population with at least associate's degree education in the United States with a correlation coefficient (R) of -0.136 and weighted average of 50.2%, a difference of 2.5%.
Associate's Degree Correlation Summary
| Measurement | Palestinian | Immigrants from Moldova |
| Minimum | 16.3% | 17.8% |
| Maximum | 76.3% | 68.9% |
| Range | 60.0% | 51.1% |
| Mean | 45.5% | 44.5% |
| Median | 46.9% | 48.0% |
| Interquartile 25% (IQ1) | 36.9% | 36.7% |
| Interquartile 75% (IQ3) | 52.6% | 52.6% |
| Interquartile Range (IQR) | 15.7% | 15.8% |
| Standard Deviation (Sample) | 13.0% | 11.8% |
| Standard Deviation (Population) | 12.9% | 11.6% |
Similar Demographics by Associate's Degree
Demographics Similar to Palestinians by Associate's Degree
In terms of associate's degree, the demographic groups most similar to Palestinians are Immigrants from Chile (49.0%, a difference of 0.0%), Arab (49.0%, a difference of 0.0%), Luxembourger (48.9%, a difference of 0.070%), British (48.9%, a difference of 0.13%), and Afghan (48.9%, a difference of 0.18%).
| Demographics | Rating | Rank | Associate's Degree |
| Immigrants | Italy | 96.7 /100 | #106 | Exceptional 49.3% |
| Syrians | 96.7 /100 | #107 | Exceptional 49.3% |
| Jordanians | 96.6 /100 | #108 | Exceptional 49.2% |
| Immigrants | Morocco | 96.3 /100 | #109 | Exceptional 49.2% |
| Austrians | 95.8 /100 | #110 | Exceptional 49.1% |
| Immigrants | Venezuela | 95.8 /100 | #111 | Exceptional 49.1% |
| Immigrants | Chile | 95.3 /100 | #112 | Exceptional 49.0% |
| Palestinians | 95.3 /100 | #113 | Exceptional 49.0% |
| Arabs | 95.3 /100 | #114 | Exceptional 49.0% |
| Luxembourgers | 95.1 /100 | #115 | Exceptional 48.9% |
| British | 95.0 /100 | #116 | Exceptional 48.9% |
| Afghans | 94.8 /100 | #117 | Exceptional 48.9% |
| Albanians | 94.7 /100 | #118 | Exceptional 48.8% |
| Lebanese | 94.6 /100 | #119 | Exceptional 48.8% |
| Alsatians | 94.6 /100 | #120 | Exceptional 48.8% |
Demographics Similar to Immigrants from Moldova by Associate's Degree
In terms of associate's degree, the demographic groups most similar to Immigrants from Moldova are Immigrants from Canada (50.1%, a difference of 0.070%), Immigrants from Western Europe (50.1%, a difference of 0.080%), Immigrants from Ethiopia (50.1%, a difference of 0.080%), Immigrants from Croatia (50.2%, a difference of 0.12%), and Immigrants from Egypt (50.2%, a difference of 0.13%).
| Demographics | Rating | Rank | Associate's Degree |
| Armenians | 99.1 /100 | #80 | Exceptional 50.4% |
| Maltese | 99.1 /100 | #81 | Exceptional 50.4% |
| Greeks | 98.9 /100 | #82 | Exceptional 50.3% |
| Immigrants | Uzbekistan | 98.9 /100 | #83 | Exceptional 50.3% |
| Immigrants | Hungary | 98.9 /100 | #84 | Exceptional 50.2% |
| Immigrants | Egypt | 98.9 /100 | #85 | Exceptional 50.2% |
| Immigrants | Croatia | 98.9 /100 | #86 | Exceptional 50.2% |
| Immigrants | Moldova | 98.8 /100 | #87 | Exceptional 50.2% |
| Immigrants | Canada | 98.7 /100 | #88 | Exceptional 50.1% |
| Immigrants | Western Europe | 98.7 /100 | #89 | Exceptional 50.1% |
| Immigrants | Ethiopia | 98.7 /100 | #90 | Exceptional 50.1% |
| Immigrants | Western Asia | 98.7 /100 | #91 | Exceptional 50.1% |
| Immigrants | North America | 98.7 /100 | #92 | Exceptional 50.1% |
| Immigrants | Brazil | 98.5 /100 | #93 | Exceptional 50.0% |
| Laotians | 98.4 /100 | #94 | Exceptional 49.9% |