Honduran vs Immigrants from Colombia Per Capita Income
COMPARE
Honduran
Immigrants from Colombia
Per Capita Income
Per Capita Income Comparison
Hondurans
Immigrants from Colombia
$37,031
PER CAPITA INCOME
0.1/ 100
METRIC RATING
304th/ 347
METRIC RANK
$42,971
PER CAPITA INCOME
31.5/ 100
METRIC RATING
187th/ 347
METRIC RANK
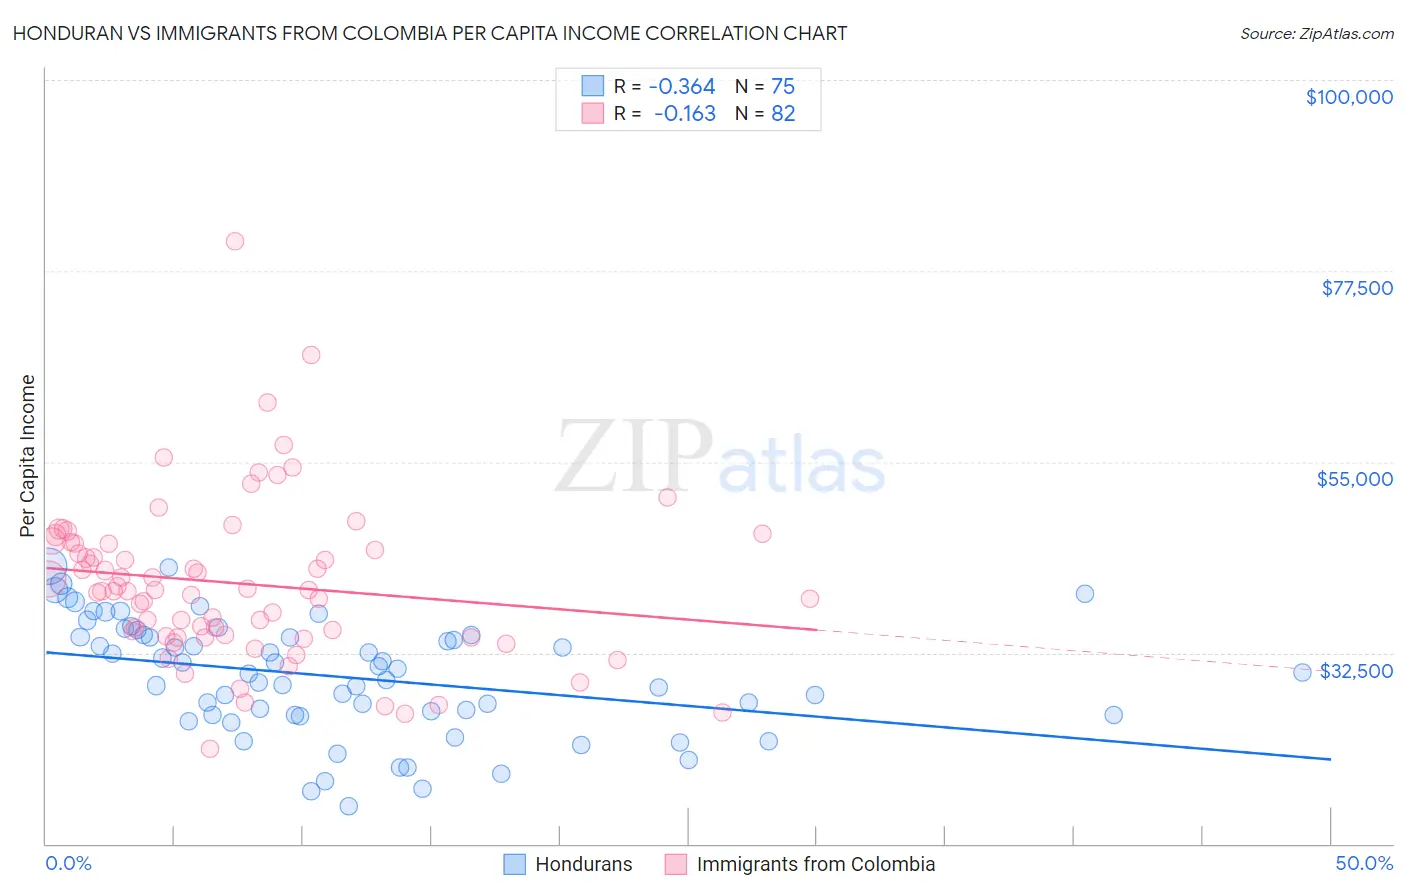
Honduran vs Immigrants from Colombia Per Capita Income Correlation Chart
The statistical analysis conducted on geographies consisting of 357,835,074 people shows a mild negative correlation between the proportion of Hondurans and per capita income in the United States with a correlation coefficient (R) of -0.364 and weighted average of $37,031. Similarly, the statistical analysis conducted on geographies consisting of 378,698,677 people shows a poor negative correlation between the proportion of Immigrants from Colombia and per capita income in the United States with a correlation coefficient (R) of -0.163 and weighted average of $42,971, a difference of 16.0%.
Per Capita Income Correlation Summary
| Measurement | Honduran | Immigrants from Colombia |
| Minimum | $14,358 | $21,139 |
| Maximum | $42,674 | $80,934 |
| Range | $28,316 | $59,795 |
| Mean | $29,671 | $40,659 |
| Median | $30,191 | $39,822 |
| Interquartile 25% (IQ1) | $25,099 | $34,523 |
| Interquartile 75% (IQ3) | $34,632 | $45,376 |
| Interquartile Range (IQR) | $9,533 | $10,853 |
| Standard Deviation (Sample) | $6,736 | $9,573 |
| Standard Deviation (Population) | $6,690 | $9,515 |
Similar Demographics by Per Capita Income
Demographics Similar to Hondurans by Per Capita Income
In terms of per capita income, the demographic groups most similar to Hondurans are Inupiat ($36,999, a difference of 0.080%), Paiute ($37,066, a difference of 0.090%), Shoshone ($37,072, a difference of 0.11%), Ottawa ($37,101, a difference of 0.19%), and Immigrants from Bahamas ($37,193, a difference of 0.44%).
| Demographics | Rating | Rank | Per Capita Income |
| Haitians | 0.1 /100 | #297 | Tragic $37,289 |
| Immigrants | Caribbean | 0.1 /100 | #298 | Tragic $37,254 |
| Cherokee | 0.1 /100 | #299 | Tragic $37,203 |
| Immigrants | Bahamas | 0.1 /100 | #300 | Tragic $37,193 |
| Ottawa | 0.1 /100 | #301 | Tragic $37,101 |
| Shoshone | 0.1 /100 | #302 | Tragic $37,072 |
| Paiute | 0.1 /100 | #303 | Tragic $37,066 |
| Hondurans | 0.1 /100 | #304 | Tragic $37,031 |
| Inupiat | 0.1 /100 | #305 | Tragic $36,999 |
| Immigrants | Haiti | 0.0 /100 | #306 | Tragic $36,849 |
| Immigrants | Latin America | 0.0 /100 | #307 | Tragic $36,823 |
| Fijians | 0.0 /100 | #308 | Tragic $36,690 |
| Immigrants | Honduras | 0.0 /100 | #309 | Tragic $36,665 |
| Ute | 0.0 /100 | #310 | Tragic $36,651 |
| Chippewa | 0.0 /100 | #311 | Tragic $36,631 |
Demographics Similar to Immigrants from Colombia by Per Capita Income
In terms of per capita income, the demographic groups most similar to Immigrants from Colombia are Immigrants from Africa ($42,950, a difference of 0.050%), French Canadian ($43,003, a difference of 0.070%), Immigrants ($43,010, a difference of 0.090%), Spaniard ($43,028, a difference of 0.13%), and Bermudan ($42,911, a difference of 0.14%).
| Demographics | Rating | Rank | Per Capita Income |
| Sierra Leoneans | 42.9 /100 | #180 | Average $43,405 |
| Welsh | 38.2 /100 | #181 | Fair $43,233 |
| Immigrants | Vietnam | 38.1 /100 | #182 | Fair $43,229 |
| Germans | 33.9 /100 | #183 | Fair $43,067 |
| Spaniards | 32.9 /100 | #184 | Fair $43,028 |
| Immigrants | Immigrants | 32.5 /100 | #185 | Fair $43,010 |
| French Canadians | 32.3 /100 | #186 | Fair $43,003 |
| Immigrants | Colombia | 31.5 /100 | #187 | Fair $42,971 |
| Immigrants | Africa | 31.0 /100 | #188 | Fair $42,950 |
| Bermudans | 30.1 /100 | #189 | Fair $42,911 |
| Kenyans | 27.7 /100 | #190 | Fair $42,808 |
| Yugoslavians | 27.4 /100 | #191 | Fair $42,792 |
| Iraqis | 26.7 /100 | #192 | Fair $42,760 |
| Immigrants | Sierra Leone | 26.5 /100 | #193 | Fair $42,752 |
| Immigrants | Fiji | 25.2 /100 | #194 | Fair $42,694 |