Immigrants from Cabo Verde vs Immigrants from Colombia Per Capita Income
COMPARE
Immigrants from Cabo Verde
Immigrants from Colombia
Per Capita Income
Per Capita Income Comparison
Immigrants from Cabo Verde
Immigrants from Colombia
$38,540
PER CAPITA INCOME
0.3/ 100
METRIC RATING
272nd/ 347
METRIC RANK
$42,971
PER CAPITA INCOME
31.5/ 100
METRIC RATING
187th/ 347
METRIC RANK
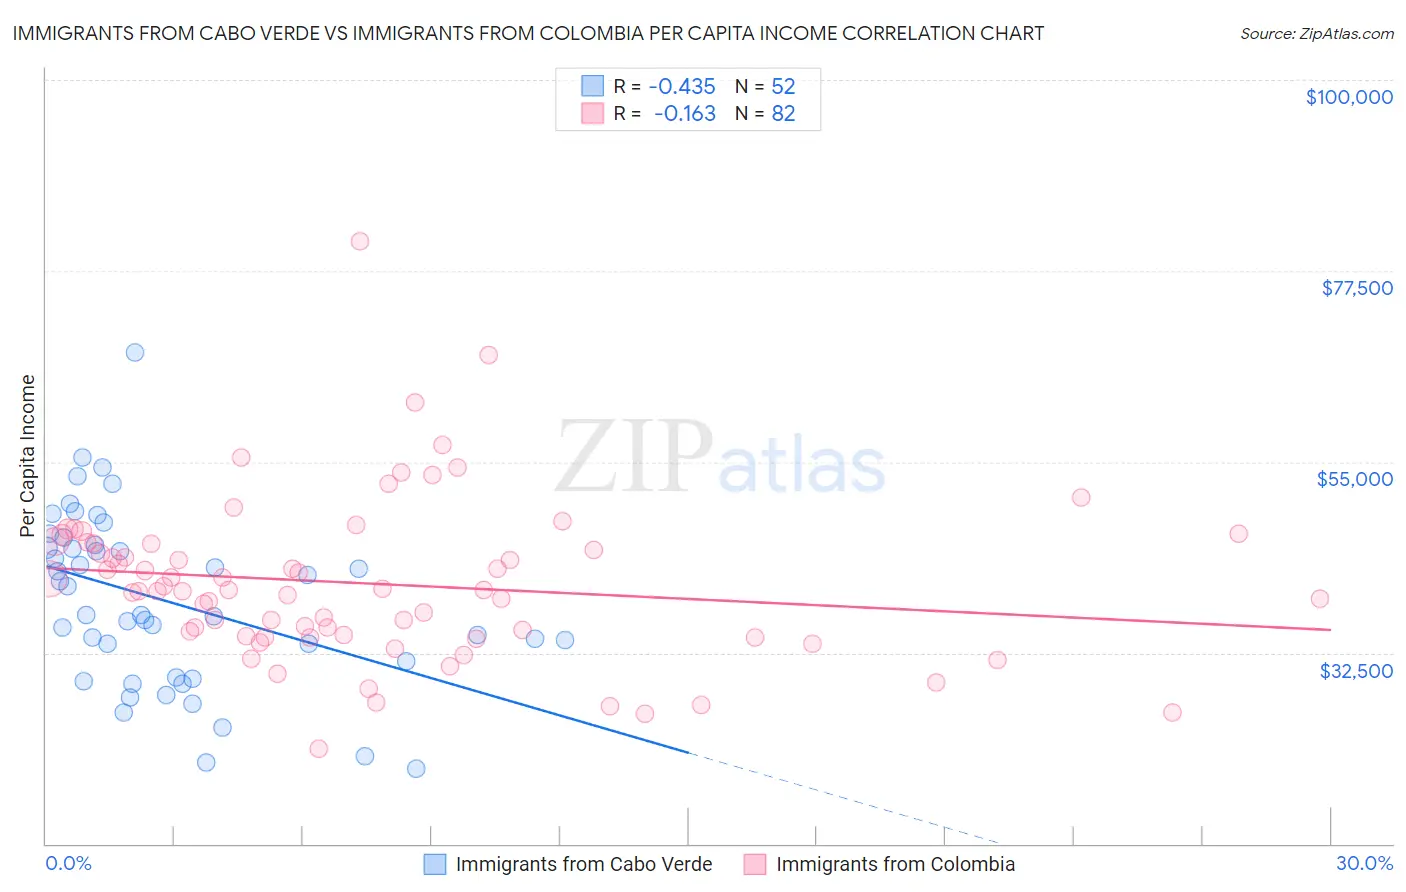
Immigrants from Cabo Verde vs Immigrants from Colombia Per Capita Income Correlation Chart
The statistical analysis conducted on geographies consisting of 38,153,224 people shows a moderate negative correlation between the proportion of Immigrants from Cabo Verde and per capita income in the United States with a correlation coefficient (R) of -0.435 and weighted average of $38,540. Similarly, the statistical analysis conducted on geographies consisting of 378,698,677 people shows a poor negative correlation between the proportion of Immigrants from Colombia and per capita income in the United States with a correlation coefficient (R) of -0.163 and weighted average of $42,971, a difference of 11.5%.
Per Capita Income Correlation Summary
| Measurement | Immigrants from Cabo Verde | Immigrants from Colombia |
| Minimum | $18,870 | $21,139 |
| Maximum | $67,818 | $80,934 |
| Range | $48,948 | $59,795 |
| Mean | $38,585 | $40,659 |
| Median | $36,913 | $39,822 |
| Interquartile 25% (IQ1) | $30,580 | $34,523 |
| Interquartile 75% (IQ3) | $45,064 | $45,376 |
| Interquartile Range (IQR) | $14,484 | $10,853 |
| Standard Deviation (Sample) | $10,185 | $9,573 |
| Standard Deviation (Population) | $10,087 | $9,515 |
Similar Demographics by Per Capita Income
Demographics Similar to Immigrants from Cabo Verde by Per Capita Income
In terms of per capita income, the demographic groups most similar to Immigrants from Cabo Verde are Central American ($38,560, a difference of 0.050%), Immigrants from Belize ($38,614, a difference of 0.19%), Nepalese ($38,442, a difference of 0.25%), Immigrants from El Salvador ($38,394, a difference of 0.38%), and Immigrants from Jamaica ($38,766, a difference of 0.59%).
| Demographics | Rating | Rank | Per Capita Income |
| Spanish Americans | 0.5 /100 | #265 | Tragic $39,012 |
| Salvadorans | 0.5 /100 | #266 | Tragic $38,858 |
| Immigrants | Zaire | 0.4 /100 | #267 | Tragic $38,848 |
| Liberians | 0.4 /100 | #268 | Tragic $38,780 |
| Immigrants | Jamaica | 0.4 /100 | #269 | Tragic $38,766 |
| Immigrants | Belize | 0.3 /100 | #270 | Tragic $38,614 |
| Central Americans | 0.3 /100 | #271 | Tragic $38,560 |
| Immigrants | Cabo Verde | 0.3 /100 | #272 | Tragic $38,540 |
| Nepalese | 0.3 /100 | #273 | Tragic $38,442 |
| Immigrants | El Salvador | 0.3 /100 | #274 | Tragic $38,394 |
| Immigrants | Liberia | 0.2 /100 | #275 | Tragic $38,165 |
| Hmong | 0.2 /100 | #276 | Tragic $38,120 |
| Comanche | 0.2 /100 | #277 | Tragic $38,088 |
| Immigrants | Nicaragua | 0.2 /100 | #278 | Tragic $38,065 |
| Colville | 0.2 /100 | #279 | Tragic $38,047 |
Demographics Similar to Immigrants from Colombia by Per Capita Income
In terms of per capita income, the demographic groups most similar to Immigrants from Colombia are Immigrants from Africa ($42,950, a difference of 0.050%), French Canadian ($43,003, a difference of 0.070%), Immigrants ($43,010, a difference of 0.090%), Spaniard ($43,028, a difference of 0.13%), and Bermudan ($42,911, a difference of 0.14%).
| Demographics | Rating | Rank | Per Capita Income |
| Sierra Leoneans | 42.9 /100 | #180 | Average $43,405 |
| Welsh | 38.2 /100 | #181 | Fair $43,233 |
| Immigrants | Vietnam | 38.1 /100 | #182 | Fair $43,229 |
| Germans | 33.9 /100 | #183 | Fair $43,067 |
| Spaniards | 32.9 /100 | #184 | Fair $43,028 |
| Immigrants | Immigrants | 32.5 /100 | #185 | Fair $43,010 |
| French Canadians | 32.3 /100 | #186 | Fair $43,003 |
| Immigrants | Colombia | 31.5 /100 | #187 | Fair $42,971 |
| Immigrants | Africa | 31.0 /100 | #188 | Fair $42,950 |
| Bermudans | 30.1 /100 | #189 | Fair $42,911 |
| Kenyans | 27.7 /100 | #190 | Fair $42,808 |
| Yugoslavians | 27.4 /100 | #191 | Fair $42,792 |
| Iraqis | 26.7 /100 | #192 | Fair $42,760 |
| Immigrants | Sierra Leone | 26.5 /100 | #193 | Fair $42,752 |
| Immigrants | Fiji | 25.2 /100 | #194 | Fair $42,694 |