Palestinian vs Hispanic or Latino Seniors Poverty Over the Age of 75
COMPARE
Palestinian
Hispanic or Latino
Seniors Poverty Over the Age of 75
Seniors Poverty Over the Age of 75 Comparison
Palestinians
Hispanics or Latinos
11.4%
SENIORS POVERTY OVER THE AGE OF 75
95.8/ 100
METRIC RATING
75th/ 347
METRIC RANK
15.8%
SENIORS POVERTY OVER THE AGE OF 75
0.0/ 100
METRIC RATING
306th/ 347
METRIC RANK
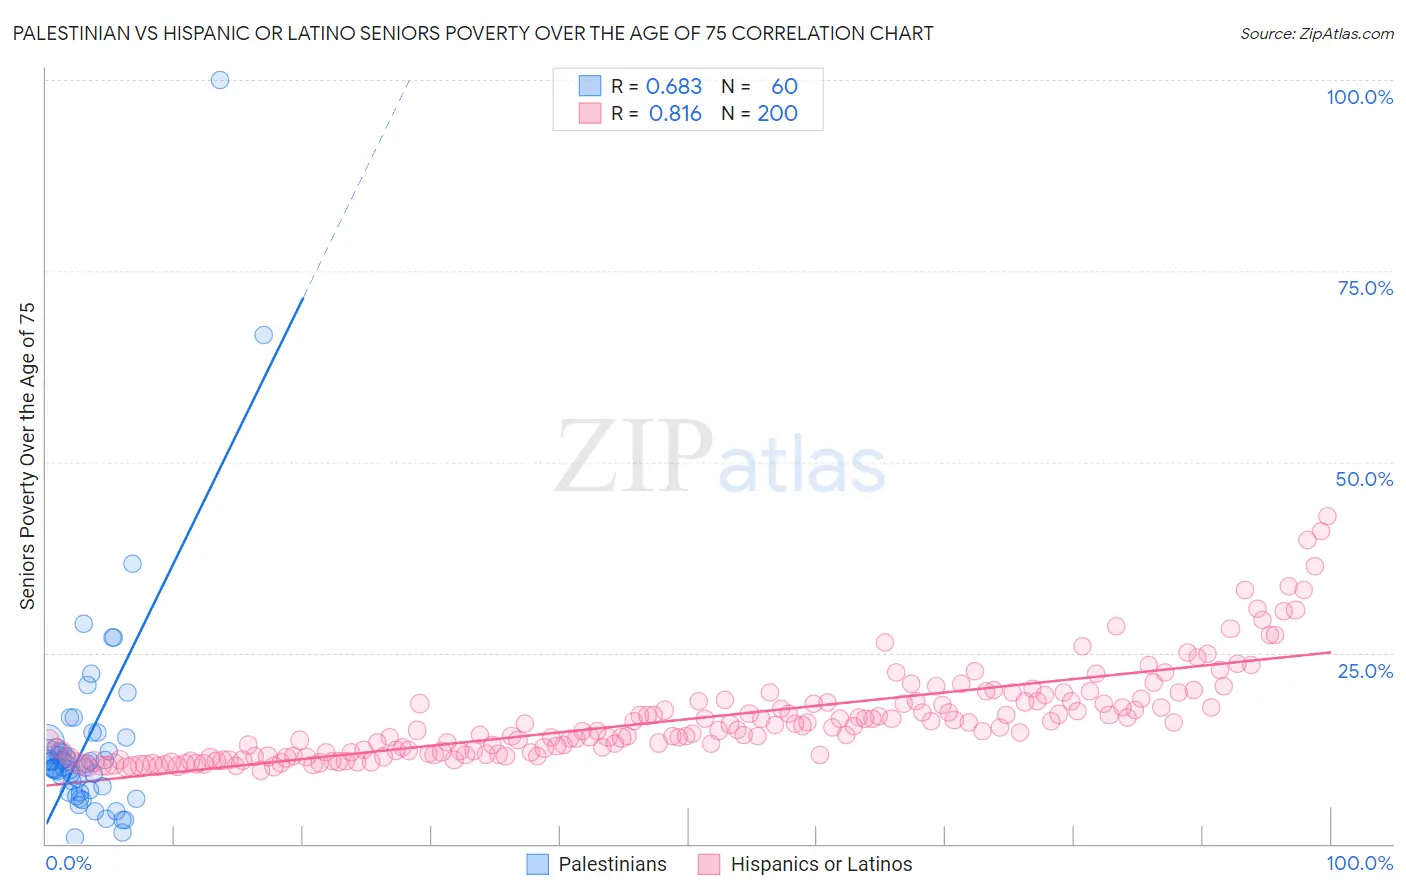
Palestinian vs Hispanic or Latino Seniors Poverty Over the Age of 75 Correlation Chart
The statistical analysis conducted on geographies consisting of 215,392,274 people shows a significant positive correlation between the proportion of Palestinians and poverty level among seniors over the age of 75 in the United States with a correlation coefficient (R) of 0.683 and weighted average of 11.4%. Similarly, the statistical analysis conducted on geographies consisting of 560,283,228 people shows a very strong positive correlation between the proportion of Hispanics or Latinos and poverty level among seniors over the age of 75 in the United States with a correlation coefficient (R) of 0.816 and weighted average of 15.8%, a difference of 38.1%.
Seniors Poverty Over the Age of 75 Correlation Summary
| Measurement | Palestinian | Hispanic or Latino |
| Minimum | 0.80% | 9.6% |
| Maximum | 100.0% | 42.9% |
| Range | 99.2% | 33.3% |
| Mean | 13.7% | 16.3% |
| Median | 10.5% | 14.8% |
| Interquartile 25% (IQ1) | 7.3% | 11.7% |
| Interquartile 75% (IQ3) | 12.9% | 18.5% |
| Interquartile Range (IQR) | 5.7% | 6.8% |
| Standard Deviation (Sample) | 15.0% | 6.2% |
| Standard Deviation (Population) | 14.8% | 6.2% |
Similar Demographics by Seniors Poverty Over the Age of 75
Demographics Similar to Palestinians by Seniors Poverty Over the Age of 75
In terms of seniors poverty over the age of 75, the demographic groups most similar to Palestinians are French Canadian (11.4%, a difference of 0.070%), Delaware (11.4%, a difference of 0.10%), Immigrants from Micronesia (11.4%, a difference of 0.11%), White/Caucasian (11.4%, a difference of 0.15%), and Macedonian (11.4%, a difference of 0.16%).
| Demographics | Rating | Rank | Seniors Poverty Over the Age of 75 |
| Immigrants | Austria | 96.5 /100 | #68 | Exceptional 11.4% |
| Ottawa | 96.5 /100 | #69 | Exceptional 11.4% |
| Immigrants | South Central Asia | 96.4 /100 | #70 | Exceptional 11.4% |
| Osage | 96.3 /100 | #71 | Exceptional 11.4% |
| Sierra Leoneans | 96.1 /100 | #72 | Exceptional 11.4% |
| Immigrants | Micronesia | 96.0 /100 | #73 | Exceptional 11.4% |
| Delaware | 96.0 /100 | #74 | Exceptional 11.4% |
| Palestinians | 95.8 /100 | #75 | Exceptional 11.4% |
| French Canadians | 95.7 /100 | #76 | Exceptional 11.4% |
| Whites/Caucasians | 95.5 /100 | #77 | Exceptional 11.4% |
| Macedonians | 95.5 /100 | #78 | Exceptional 11.4% |
| Filipinos | 95.5 /100 | #79 | Exceptional 11.4% |
| Alaska Natives | 95.4 /100 | #80 | Exceptional 11.4% |
| Basques | 95.1 /100 | #81 | Exceptional 11.5% |
| Iranians | 95.1 /100 | #82 | Exceptional 11.5% |
Demographics Similar to Hispanics or Latinos by Seniors Poverty Over the Age of 75
In terms of seniors poverty over the age of 75, the demographic groups most similar to Hispanics or Latinos are Immigrants from West Indies (15.8%, a difference of 0.13%), Ecuadorian (15.7%, a difference of 0.16%), Immigrants from Bangladesh (15.8%, a difference of 0.18%), Immigrants from Trinidad and Tobago (15.7%, a difference of 0.20%), and Immigrants from Honduras (15.7%, a difference of 0.38%).
| Demographics | Rating | Rank | Seniors Poverty Over the Age of 75 |
| Spanish American Indians | 0.0 /100 | #299 | Tragic 15.5% |
| Bahamians | 0.0 /100 | #300 | Tragic 15.5% |
| Immigrants | Latin America | 0.0 /100 | #301 | Tragic 15.6% |
| West Indians | 0.0 /100 | #302 | Tragic 15.7% |
| Immigrants | Honduras | 0.0 /100 | #303 | Tragic 15.7% |
| Immigrants | Trinidad and Tobago | 0.0 /100 | #304 | Tragic 15.7% |
| Ecuadorians | 0.0 /100 | #305 | Tragic 15.7% |
| Hispanics or Latinos | 0.0 /100 | #306 | Tragic 15.8% |
| Immigrants | West Indies | 0.0 /100 | #307 | Tragic 15.8% |
| Immigrants | Bangladesh | 0.0 /100 | #308 | Tragic 15.8% |
| Yup'ik | 0.0 /100 | #309 | Tragic 15.8% |
| Vietnamese | 0.0 /100 | #310 | Tragic 15.9% |
| Trinidadians and Tobagonians | 0.0 /100 | #311 | Tragic 15.9% |
| Crow | 0.0 /100 | #312 | Tragic 15.9% |
| Barbadians | 0.0 /100 | #313 | Tragic 16.0% |