Immigrants from Colombia vs Hispanic or Latino Per Capita Income
COMPARE
Immigrants from Colombia
Hispanic or Latino
Per Capita Income
Per Capita Income Comparison
Immigrants from Colombia
Hispanics or Latinos
$42,971
PER CAPITA INCOME
31.5/ 100
METRIC RATING
187th/ 347
METRIC RANK
$35,688
PER CAPITA INCOME
0.0/ 100
METRIC RATING
320th/ 347
METRIC RANK
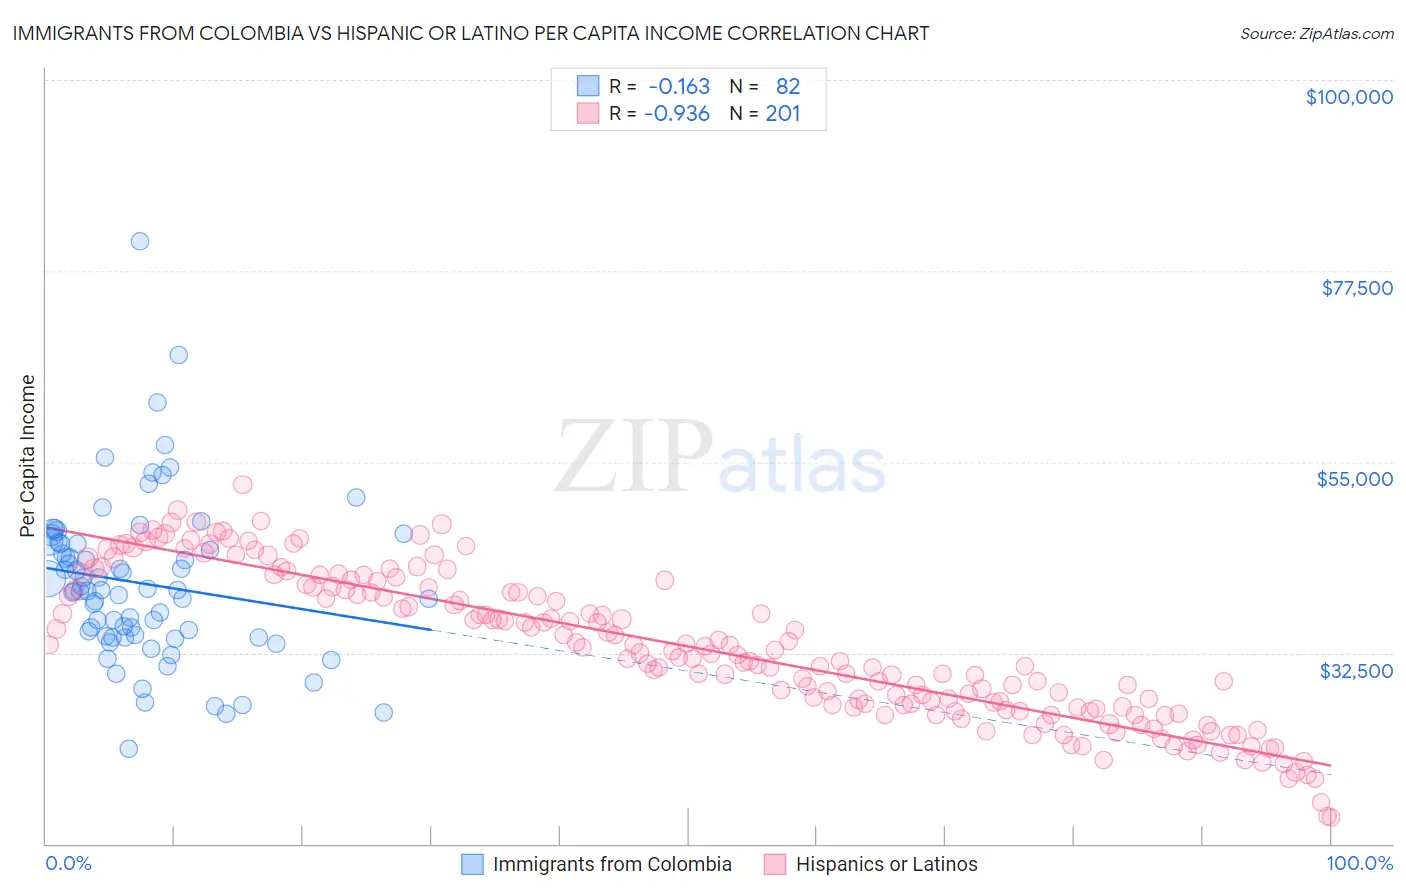
Immigrants from Colombia vs Hispanic or Latino Per Capita Income Correlation Chart
The statistical analysis conducted on geographies consisting of 378,698,677 people shows a poor negative correlation between the proportion of Immigrants from Colombia and per capita income in the United States with a correlation coefficient (R) of -0.163 and weighted average of $42,971. Similarly, the statistical analysis conducted on geographies consisting of 578,671,475 people shows a near-perfect negative correlation between the proportion of Hispanics or Latinos and per capita income in the United States with a correlation coefficient (R) of -0.936 and weighted average of $35,688, a difference of 20.4%.
Per Capita Income Correlation Summary
| Measurement | Immigrants from Colombia | Hispanic or Latino |
| Minimum | $21,139 | $13,071 |
| Maximum | $80,934 | $52,297 |
| Range | $59,795 | $39,226 |
| Mean | $40,659 | $33,168 |
| Median | $39,822 | $32,664 |
| Interquartile 25% (IQ1) | $34,523 | $26,111 |
| Interquartile 75% (IQ3) | $45,376 | $40,424 |
| Interquartile Range (IQR) | $10,853 | $14,314 |
| Standard Deviation (Sample) | $9,573 | $8,715 |
| Standard Deviation (Population) | $9,515 | $8,693 |
Similar Demographics by Per Capita Income
Demographics Similar to Immigrants from Colombia by Per Capita Income
In terms of per capita income, the demographic groups most similar to Immigrants from Colombia are Immigrants from Africa ($42,950, a difference of 0.050%), French Canadian ($43,003, a difference of 0.070%), Immigrants ($43,010, a difference of 0.090%), Spaniard ($43,028, a difference of 0.13%), and Bermudan ($42,911, a difference of 0.14%).
| Demographics | Rating | Rank | Per Capita Income |
| Sierra Leoneans | 42.9 /100 | #180 | Average $43,405 |
| Welsh | 38.2 /100 | #181 | Fair $43,233 |
| Immigrants | Vietnam | 38.1 /100 | #182 | Fair $43,229 |
| Germans | 33.9 /100 | #183 | Fair $43,067 |
| Spaniards | 32.9 /100 | #184 | Fair $43,028 |
| Immigrants | Immigrants | 32.5 /100 | #185 | Fair $43,010 |
| French Canadians | 32.3 /100 | #186 | Fair $43,003 |
| Immigrants | Colombia | 31.5 /100 | #187 | Fair $42,971 |
| Immigrants | Africa | 31.0 /100 | #188 | Fair $42,950 |
| Bermudans | 30.1 /100 | #189 | Fair $42,911 |
| Kenyans | 27.7 /100 | #190 | Fair $42,808 |
| Yugoslavians | 27.4 /100 | #191 | Fair $42,792 |
| Iraqis | 26.7 /100 | #192 | Fair $42,760 |
| Immigrants | Sierra Leone | 26.5 /100 | #193 | Fair $42,752 |
| Immigrants | Fiji | 25.2 /100 | #194 | Fair $42,694 |
Demographics Similar to Hispanics or Latinos by Per Capita Income
In terms of per capita income, the demographic groups most similar to Hispanics or Latinos are Immigrants from Congo ($35,720, a difference of 0.090%), Black/African American ($35,564, a difference of 0.35%), Creek ($35,546, a difference of 0.40%), Bangladeshi ($35,897, a difference of 0.59%), and Dutch West Indian ($35,922, a difference of 0.66%).
| Demographics | Rating | Rank | Per Capita Income |
| Bahamians | 0.0 /100 | #313 | Tragic $36,427 |
| Seminole | 0.0 /100 | #314 | Tragic $36,180 |
| Yaqui | 0.0 /100 | #315 | Tragic $36,112 |
| Choctaw | 0.0 /100 | #316 | Tragic $35,999 |
| Dutch West Indians | 0.0 /100 | #317 | Tragic $35,922 |
| Bangladeshis | 0.0 /100 | #318 | Tragic $35,897 |
| Immigrants | Congo | 0.0 /100 | #319 | Tragic $35,720 |
| Hispanics or Latinos | 0.0 /100 | #320 | Tragic $35,688 |
| Blacks/African Americans | 0.0 /100 | #321 | Tragic $35,564 |
| Creek | 0.0 /100 | #322 | Tragic $35,546 |
| Cheyenne | 0.0 /100 | #323 | Tragic $35,276 |
| Kiowa | 0.0 /100 | #324 | Tragic $35,102 |
| Immigrants | Central America | 0.0 /100 | #325 | Tragic $34,974 |
| Immigrants | Cuba | 0.0 /100 | #326 | Tragic $34,910 |
| Apache | 0.0 /100 | #327 | Tragic $34,886 |