Palestinian vs Norwegian Median Male Earnings
COMPARE
Palestinian
Norwegian
Median Male Earnings
Median Male Earnings Comparison
Palestinians
Norwegians
$57,778
MEDIAN MALE EARNINGS
96.2/ 100
METRIC RATING
110th/ 347
METRIC RANK
$55,965
MEDIAN MALE EARNINGS
80.9/ 100
METRIC RATING
145th/ 347
METRIC RANK
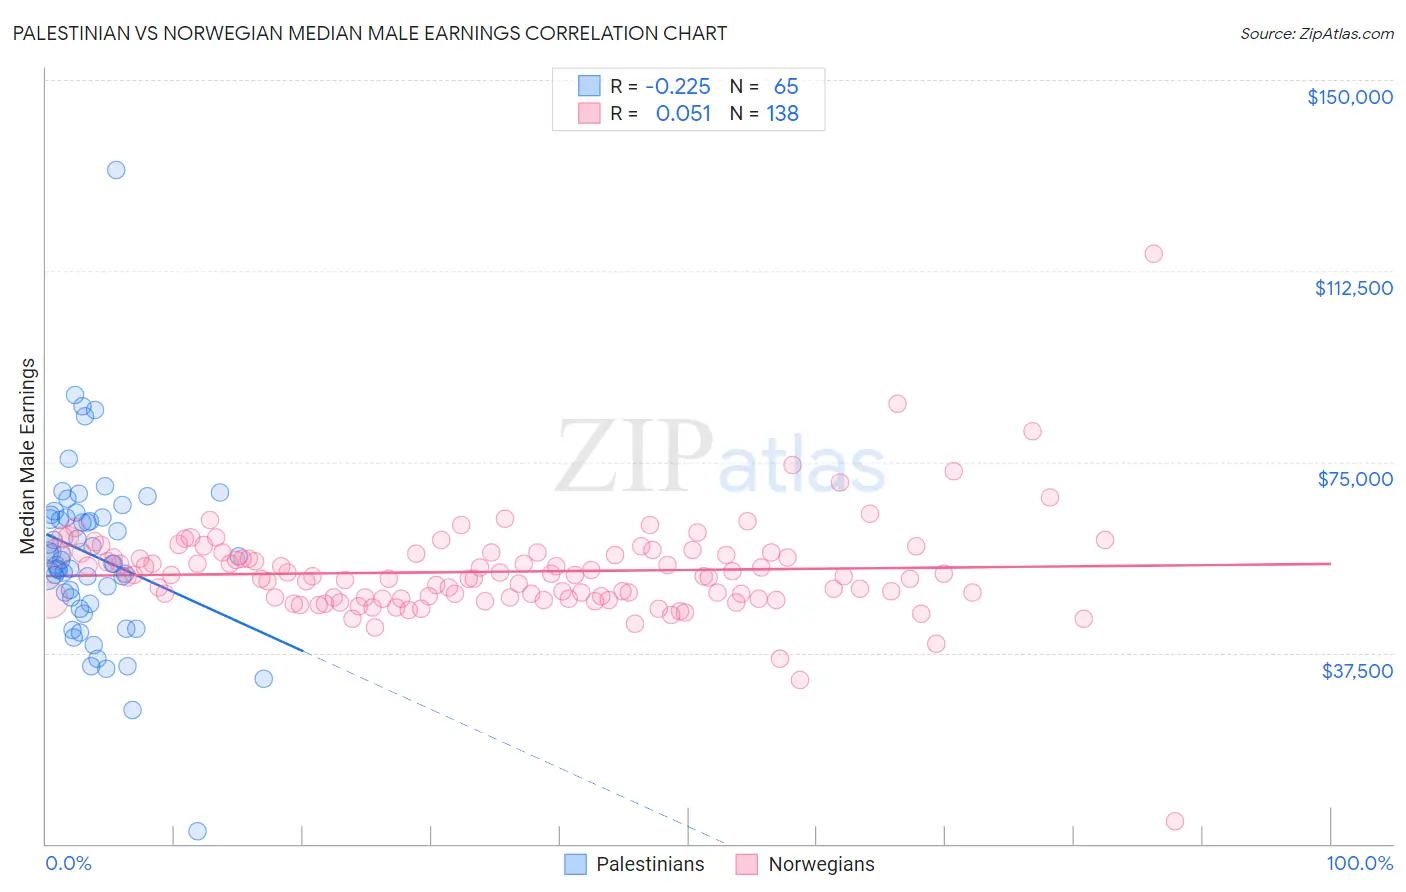
Palestinian vs Norwegian Median Male Earnings Correlation Chart
The statistical analysis conducted on geographies consisting of 216,446,429 people shows a weak negative correlation between the proportion of Palestinians and median male earnings in the United States with a correlation coefficient (R) of -0.225 and weighted average of $57,778. Similarly, the statistical analysis conducted on geographies consisting of 532,659,369 people shows a slight positive correlation between the proportion of Norwegians and median male earnings in the United States with a correlation coefficient (R) of 0.051 and weighted average of $55,965, a difference of 3.2%.
Median Male Earnings Correlation Summary
| Measurement | Palestinian | Norwegian |
| Minimum | $2,499 | $4,318 |
| Maximum | $132,344 | $115,833 |
| Range | $129,845 | $111,515 |
| Mean | $56,632 | $53,449 |
| Median | $55,657 | $52,554 |
| Interquartile 25% (IQ1) | $47,716 | $48,297 |
| Interquartile 75% (IQ3) | $64,385 | $57,158 |
| Interquartile Range (IQR) | $16,670 | $8,861 |
| Standard Deviation (Sample) | $17,442 | $10,042 |
| Standard Deviation (Population) | $17,308 | $10,005 |
Similar Demographics by Median Male Earnings
Demographics Similar to Palestinians by Median Male Earnings
In terms of median male earnings, the demographic groups most similar to Palestinians are British ($57,890, a difference of 0.19%), European ($57,637, a difference of 0.25%), Immigrants from Uzbekistan ($57,941, a difference of 0.28%), Serbian ($57,975, a difference of 0.34%), and Immigrants from Afghanistan ($57,582, a difference of 0.34%).
| Demographics | Rating | Rank | Median Male Earnings |
| Poles | 97.3 /100 | #103 | Exceptional $58,139 |
| Armenians | 97.3 /100 | #104 | Exceptional $58,134 |
| Immigrants | Western Asia | 97.3 /100 | #105 | Exceptional $58,131 |
| Immigrants | Northern Africa | 96.9 /100 | #106 | Exceptional $58,008 |
| Serbians | 96.8 /100 | #107 | Exceptional $57,975 |
| Immigrants | Uzbekistan | 96.7 /100 | #108 | Exceptional $57,941 |
| British | 96.5 /100 | #109 | Exceptional $57,890 |
| Palestinians | 96.2 /100 | #110 | Exceptional $57,778 |
| Europeans | 95.6 /100 | #111 | Exceptional $57,637 |
| Immigrants | Afghanistan | 95.4 /100 | #112 | Exceptional $57,582 |
| Carpatho Rusyns | 95.3 /100 | #113 | Exceptional $57,572 |
| Immigrants | Kuwait | 95.3 /100 | #114 | Exceptional $57,562 |
| Swedes | 94.8 /100 | #115 | Exceptional $57,445 |
| Lebanese | 94.6 /100 | #116 | Exceptional $57,409 |
| Immigrants | Zimbabwe | 94.3 /100 | #117 | Exceptional $57,352 |
Demographics Similar to Norwegians by Median Male Earnings
In terms of median male earnings, the demographic groups most similar to Norwegians are Immigrants from Chile ($55,954, a difference of 0.020%), Immigrants from Uganda ($56,064, a difference of 0.18%), Immigrants from Philippines ($55,809, a difference of 0.28%), Sri Lankan ($56,136, a difference of 0.31%), and Scottish ($55,793, a difference of 0.31%).
| Demographics | Rating | Rank | Median Male Earnings |
| Slovaks | 85.5 /100 | #138 | Excellent $56,306 |
| Zimbabweans | 85.5 /100 | #139 | Excellent $56,302 |
| Luxembourgers | 85.5 /100 | #140 | Excellent $56,300 |
| Danes | 84.8 /100 | #141 | Excellent $56,246 |
| Ethiopians | 84.8 /100 | #142 | Excellent $56,243 |
| Sri Lankans | 83.4 /100 | #143 | Excellent $56,136 |
| Immigrants | Uganda | 82.4 /100 | #144 | Excellent $56,064 |
| Norwegians | 80.9 /100 | #145 | Excellent $55,965 |
| Immigrants | Chile | 80.7 /100 | #146 | Excellent $55,954 |
| Immigrants | Philippines | 78.4 /100 | #147 | Good $55,809 |
| Scottish | 78.2 /100 | #148 | Good $55,793 |
| English | 77.4 /100 | #149 | Good $55,747 |
| Swiss | 77.1 /100 | #150 | Good $55,731 |
| Immigrants | Oceania | 76.8 /100 | #151 | Good $55,712 |
| Peruvians | 75.8 /100 | #152 | Good $55,659 |