Palestinian vs Immigrants from Ethiopia Median Male Earnings
COMPARE
Palestinian
Immigrants from Ethiopia
Median Male Earnings
Median Male Earnings Comparison
Palestinians
Immigrants from Ethiopia
$57,778
MEDIAN MALE EARNINGS
96.2/ 100
METRIC RATING
110th/ 347
METRIC RANK
$55,434
MEDIAN MALE EARNINGS
71.6/ 100
METRIC RATING
156th/ 347
METRIC RANK
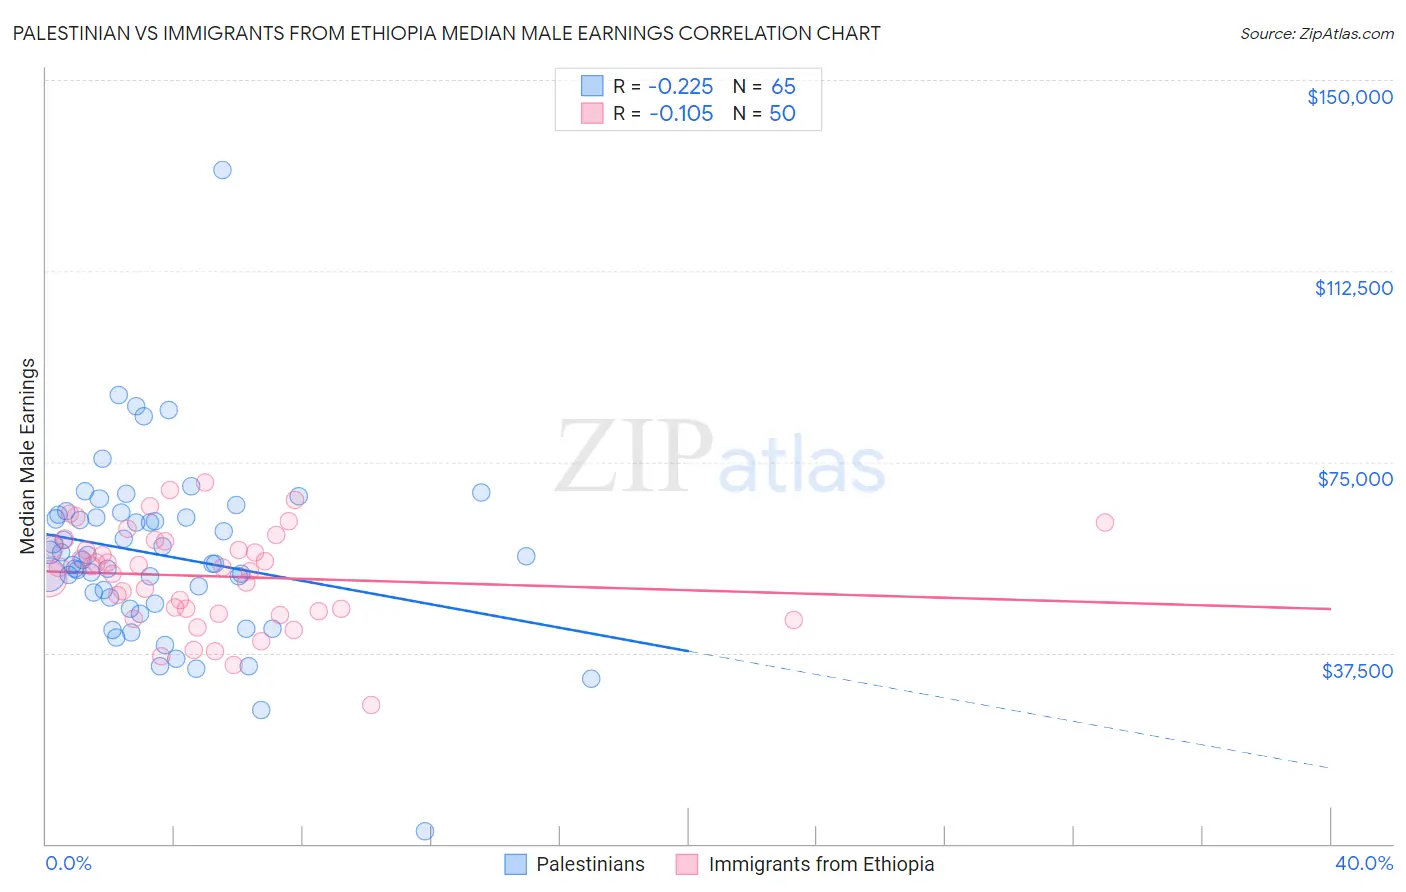
Palestinian vs Immigrants from Ethiopia Median Male Earnings Correlation Chart
The statistical analysis conducted on geographies consisting of 216,446,429 people shows a weak negative correlation between the proportion of Palestinians and median male earnings in the United States with a correlation coefficient (R) of -0.225 and weighted average of $57,778. Similarly, the statistical analysis conducted on geographies consisting of 211,550,468 people shows a poor negative correlation between the proportion of Immigrants from Ethiopia and median male earnings in the United States with a correlation coefficient (R) of -0.105 and weighted average of $55,434, a difference of 4.2%.
Median Male Earnings Correlation Summary
| Measurement | Palestinian | Immigrants from Ethiopia |
| Minimum | $2,499 | $27,233 |
| Maximum | $132,344 | $70,982 |
| Range | $129,845 | $43,749 |
| Mean | $56,632 | $52,533 |
| Median | $55,657 | $54,177 |
| Interquartile 25% (IQ1) | $47,716 | $45,679 |
| Interquartile 75% (IQ3) | $64,385 | $59,341 |
| Interquartile Range (IQR) | $16,670 | $13,662 |
| Standard Deviation (Sample) | $17,442 | $9,594 |
| Standard Deviation (Population) | $17,308 | $9,497 |
Similar Demographics by Median Male Earnings
Demographics Similar to Palestinians by Median Male Earnings
In terms of median male earnings, the demographic groups most similar to Palestinians are British ($57,890, a difference of 0.19%), European ($57,637, a difference of 0.25%), Immigrants from Uzbekistan ($57,941, a difference of 0.28%), Serbian ($57,975, a difference of 0.34%), and Immigrants from Afghanistan ($57,582, a difference of 0.34%).
| Demographics | Rating | Rank | Median Male Earnings |
| Poles | 97.3 /100 | #103 | Exceptional $58,139 |
| Armenians | 97.3 /100 | #104 | Exceptional $58,134 |
| Immigrants | Western Asia | 97.3 /100 | #105 | Exceptional $58,131 |
| Immigrants | Northern Africa | 96.9 /100 | #106 | Exceptional $58,008 |
| Serbians | 96.8 /100 | #107 | Exceptional $57,975 |
| Immigrants | Uzbekistan | 96.7 /100 | #108 | Exceptional $57,941 |
| British | 96.5 /100 | #109 | Exceptional $57,890 |
| Palestinians | 96.2 /100 | #110 | Exceptional $57,778 |
| Europeans | 95.6 /100 | #111 | Exceptional $57,637 |
| Immigrants | Afghanistan | 95.4 /100 | #112 | Exceptional $57,582 |
| Carpatho Rusyns | 95.3 /100 | #113 | Exceptional $57,572 |
| Immigrants | Kuwait | 95.3 /100 | #114 | Exceptional $57,562 |
| Swedes | 94.8 /100 | #115 | Exceptional $57,445 |
| Lebanese | 94.6 /100 | #116 | Exceptional $57,409 |
| Immigrants | Zimbabwe | 94.3 /100 | #117 | Exceptional $57,352 |
Demographics Similar to Immigrants from Ethiopia by Median Male Earnings
In terms of median male earnings, the demographic groups most similar to Immigrants from Ethiopia are Icelander ($55,415, a difference of 0.030%), Czechoslovakian ($55,382, a difference of 0.090%), Alsatian ($55,380, a difference of 0.10%), Basque ($55,370, a difference of 0.12%), and Belgian ($55,361, a difference of 0.13%).
| Demographics | Rating | Rank | Median Male Earnings |
| English | 77.4 /100 | #149 | Good $55,747 |
| Swiss | 77.1 /100 | #150 | Good $55,731 |
| Immigrants | Oceania | 76.8 /100 | #151 | Good $55,712 |
| Peruvians | 75.8 /100 | #152 | Good $55,659 |
| Immigrants | Nepal | 75.0 /100 | #153 | Good $55,615 |
| Taiwanese | 73.9 /100 | #154 | Good $55,556 |
| Scandinavians | 73.4 /100 | #155 | Good $55,527 |
| Immigrants | Ethiopia | 71.6 /100 | #156 | Good $55,434 |
| Icelanders | 71.2 /100 | #157 | Good $55,415 |
| Czechoslovakians | 70.5 /100 | #158 | Good $55,382 |
| Alsatians | 70.5 /100 | #159 | Good $55,380 |
| Basques | 70.3 /100 | #160 | Good $55,370 |
| Belgians | 70.1 /100 | #161 | Good $55,361 |
| French | 69.9 /100 | #162 | Good $55,350 |
| Ugandans | 68.6 /100 | #163 | Good $55,290 |