Palestinian vs Immigrants from Ukraine Median Male Earnings
COMPARE
Palestinian
Immigrants from Ukraine
Median Male Earnings
Median Male Earnings Comparison
Palestinians
Immigrants from Ukraine
$57,778
MEDIAN MALE EARNINGS
96.2/ 100
METRIC RATING
110th/ 347
METRIC RANK
$59,820
MEDIAN MALE EARNINGS
99.5/ 100
METRIC RATING
79th/ 347
METRIC RANK
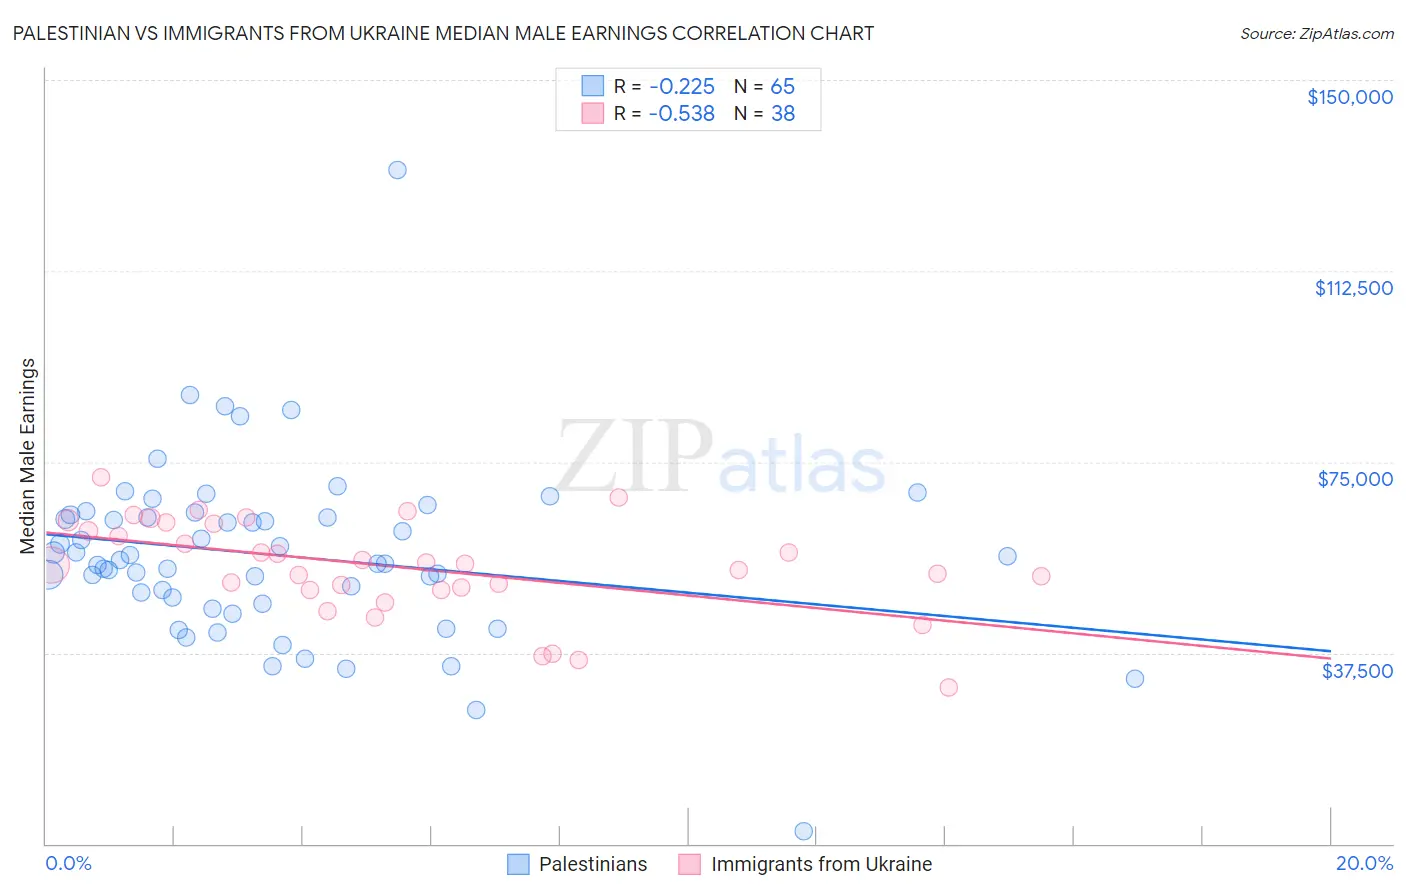
Palestinian vs Immigrants from Ukraine Median Male Earnings Correlation Chart
The statistical analysis conducted on geographies consisting of 216,446,429 people shows a weak negative correlation between the proportion of Palestinians and median male earnings in the United States with a correlation coefficient (R) of -0.225 and weighted average of $57,778. Similarly, the statistical analysis conducted on geographies consisting of 289,634,728 people shows a substantial negative correlation between the proportion of Immigrants from Ukraine and median male earnings in the United States with a correlation coefficient (R) of -0.538 and weighted average of $59,820, a difference of 3.5%.
Median Male Earnings Correlation Summary
| Measurement | Palestinian | Immigrants from Ukraine |
| Minimum | $2,499 | $30,721 |
| Maximum | $132,344 | $71,961 |
| Range | $129,845 | $41,240 |
| Mean | $56,632 | $54,290 |
| Median | $55,657 | $54,853 |
| Interquartile 25% (IQ1) | $47,716 | $49,956 |
| Interquartile 75% (IQ3) | $64,385 | $62,824 |
| Interquartile Range (IQR) | $16,670 | $12,868 |
| Standard Deviation (Sample) | $17,442 | $9,509 |
| Standard Deviation (Population) | $17,308 | $9,383 |
Similar Demographics by Median Male Earnings
Demographics Similar to Palestinians by Median Male Earnings
In terms of median male earnings, the demographic groups most similar to Palestinians are British ($57,890, a difference of 0.19%), European ($57,637, a difference of 0.25%), Immigrants from Uzbekistan ($57,941, a difference of 0.28%), Serbian ($57,975, a difference of 0.34%), and Immigrants from Afghanistan ($57,582, a difference of 0.34%).
| Demographics | Rating | Rank | Median Male Earnings |
| Poles | 97.3 /100 | #103 | Exceptional $58,139 |
| Armenians | 97.3 /100 | #104 | Exceptional $58,134 |
| Immigrants | Western Asia | 97.3 /100 | #105 | Exceptional $58,131 |
| Immigrants | Northern Africa | 96.9 /100 | #106 | Exceptional $58,008 |
| Serbians | 96.8 /100 | #107 | Exceptional $57,975 |
| Immigrants | Uzbekistan | 96.7 /100 | #108 | Exceptional $57,941 |
| British | 96.5 /100 | #109 | Exceptional $57,890 |
| Palestinians | 96.2 /100 | #110 | Exceptional $57,778 |
| Europeans | 95.6 /100 | #111 | Exceptional $57,637 |
| Immigrants | Afghanistan | 95.4 /100 | #112 | Exceptional $57,582 |
| Carpatho Rusyns | 95.3 /100 | #113 | Exceptional $57,572 |
| Immigrants | Kuwait | 95.3 /100 | #114 | Exceptional $57,562 |
| Swedes | 94.8 /100 | #115 | Exceptional $57,445 |
| Lebanese | 94.6 /100 | #116 | Exceptional $57,409 |
| Immigrants | Zimbabwe | 94.3 /100 | #117 | Exceptional $57,352 |
Demographics Similar to Immigrants from Ukraine by Median Male Earnings
In terms of median male earnings, the demographic groups most similar to Immigrants from Ukraine are Immigrants from Hungary ($59,806, a difference of 0.020%), Ukrainian ($59,728, a difference of 0.16%), Immigrants from Egypt ($59,925, a difference of 0.18%), Croatian ($59,715, a difference of 0.18%), and Immigrants from Italy ($59,691, a difference of 0.22%).
| Demographics | Rating | Rank | Median Male Earnings |
| Immigrants | Western Europe | 99.7 /100 | #72 | Exceptional $60,334 |
| Immigrants | North America | 99.7 /100 | #73 | Exceptional $60,265 |
| Argentineans | 99.6 /100 | #74 | Exceptional $60,117 |
| Immigrants | Bolivia | 99.6 /100 | #75 | Exceptional $60,088 |
| Romanians | 99.6 /100 | #76 | Exceptional $60,063 |
| Paraguayans | 99.5 /100 | #77 | Exceptional $59,975 |
| Immigrants | Egypt | 99.5 /100 | #78 | Exceptional $59,925 |
| Immigrants | Ukraine | 99.5 /100 | #79 | Exceptional $59,820 |
| Immigrants | Hungary | 99.5 /100 | #80 | Exceptional $59,806 |
| Ukrainians | 99.4 /100 | #81 | Exceptional $59,728 |
| Croatians | 99.4 /100 | #82 | Exceptional $59,715 |
| Immigrants | Italy | 99.4 /100 | #83 | Exceptional $59,691 |
| Afghans | 99.3 /100 | #84 | Exceptional $59,554 |
| Italians | 99.3 /100 | #85 | Exceptional $59,551 |
| Immigrants | England | 99.3 /100 | #86 | Exceptional $59,527 |