Palestinian vs Central American 8th Grade
COMPARE
Palestinian
Central American
8th Grade
8th Grade Comparison
Palestinians
Central Americans
96.2%
8TH GRADE
94.6/ 100
METRIC RATING
124th/ 347
METRIC RANK
91.6%
8TH GRADE
0.0/ 100
METRIC RATING
338th/ 347
METRIC RANK
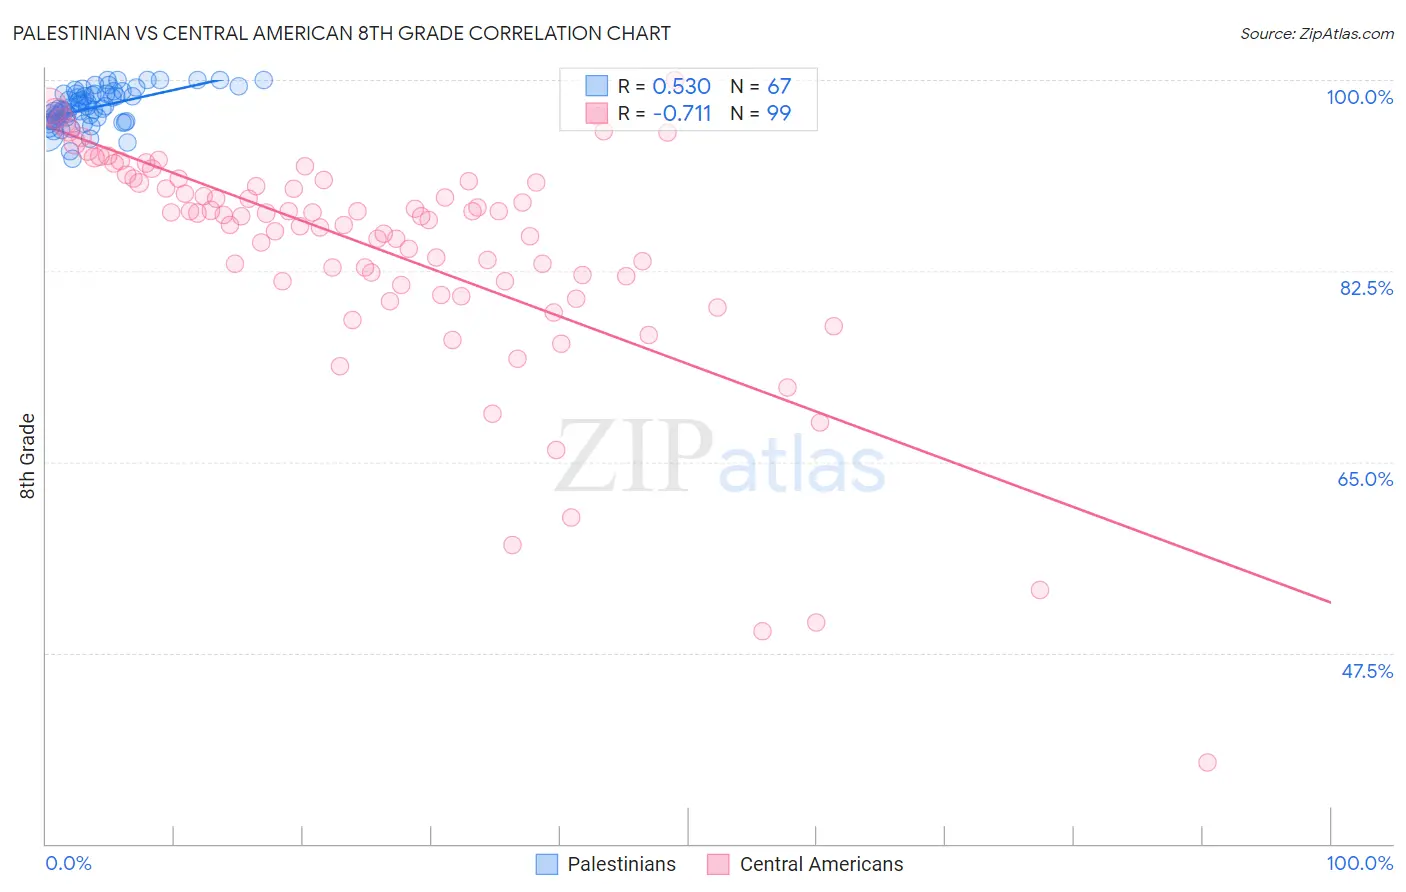
Palestinian vs Central American 8th Grade Correlation Chart
The statistical analysis conducted on geographies consisting of 216,424,519 people shows a substantial positive correlation between the proportion of Palestinians and percentage of population with at least 8th grade education in the United States with a correlation coefficient (R) of 0.530 and weighted average of 96.2%. Similarly, the statistical analysis conducted on geographies consisting of 504,619,347 people shows a strong negative correlation between the proportion of Central Americans and percentage of population with at least 8th grade education in the United States with a correlation coefficient (R) of -0.711 and weighted average of 91.6%, a difference of 5.0%.
8th Grade Correlation Summary
| Measurement | Palestinian | Central American |
| Minimum | 92.7% | 37.5% |
| Maximum | 100.0% | 100.0% |
| Range | 7.3% | 62.5% |
| Mean | 97.5% | 84.3% |
| Median | 97.4% | 87.6% |
| Interquartile 25% (IQ1) | 96.3% | 81.6% |
| Interquartile 75% (IQ3) | 98.8% | 90.8% |
| Interquartile Range (IQR) | 2.5% | 9.2% |
| Standard Deviation (Sample) | 1.7% | 10.8% |
| Standard Deviation (Population) | 1.7% | 10.7% |
Similar Demographics by 8th Grade
Demographics Similar to Palestinians by 8th Grade
In terms of 8th grade, the demographic groups most similar to Palestinians are Filipino (96.2%, a difference of 0.0%), Immigrants from Romania (96.2%, a difference of 0.010%), Immigrants from Switzerland (96.2%, a difference of 0.020%), Immigrants from France (96.2%, a difference of 0.020%), and Immigrants from Bulgaria (96.2%, a difference of 0.020%).
| Demographics | Rating | Rank | 8th Grade |
| Immigrants | Croatia | 96.0 /100 | #117 | Exceptional 96.2% |
| Immigrants | Norway | 95.7 /100 | #118 | Exceptional 96.2% |
| Immigrants | Switzerland | 95.3 /100 | #119 | Exceptional 96.2% |
| Immigrants | France | 95.3 /100 | #120 | Exceptional 96.2% |
| Immigrants | Bulgaria | 95.3 /100 | #121 | Exceptional 96.2% |
| Immigrants | Europe | 95.3 /100 | #122 | Exceptional 96.2% |
| Filipinos | 94.6 /100 | #123 | Exceptional 96.2% |
| Palestinians | 94.6 /100 | #124 | Exceptional 96.2% |
| Immigrants | Romania | 94.1 /100 | #125 | Exceptional 96.2% |
| Choctaw | 94.0 /100 | #126 | Exceptional 96.2% |
| Immigrants | Serbia | 94.0 /100 | #127 | Exceptional 96.2% |
| Immigrants | Bosnia and Herzegovina | 93.9 /100 | #128 | Exceptional 96.2% |
| Cheyenne | 93.3 /100 | #129 | Exceptional 96.1% |
| Soviet Union | 92.6 /100 | #130 | Exceptional 96.1% |
| Pueblo | 92.3 /100 | #131 | Exceptional 96.1% |
Demographics Similar to Central Americans by 8th Grade
In terms of 8th grade, the demographic groups most similar to Central Americans are Immigrants from Latin America (91.7%, a difference of 0.14%), Mexican (91.4%, a difference of 0.23%), Yakama (91.2%, a difference of 0.36%), Immigrants from Honduras (91.9%, a difference of 0.37%), and Guatemalan (91.1%, a difference of 0.47%).
| Demographics | Rating | Rank | 8th Grade |
| Hondurans | 0.0 /100 | #331 | Tragic 92.3% |
| Immigrants | Dominican Republic | 0.0 /100 | #332 | Tragic 92.3% |
| Hispanics or Latinos | 0.0 /100 | #333 | Tragic 92.2% |
| Immigrants | Yemen | 0.0 /100 | #334 | Tragic 92.1% |
| Mexican American Indians | 0.0 /100 | #335 | Tragic 92.1% |
| Immigrants | Honduras | 0.0 /100 | #336 | Tragic 91.9% |
| Immigrants | Latin America | 0.0 /100 | #337 | Tragic 91.7% |
| Central Americans | 0.0 /100 | #338 | Tragic 91.6% |
| Mexicans | 0.0 /100 | #339 | Tragic 91.4% |
| Yakama | 0.0 /100 | #340 | Tragic 91.2% |
| Guatemalans | 0.0 /100 | #341 | Tragic 91.1% |
| Salvadorans | 0.0 /100 | #342 | Tragic 90.9% |
| Immigrants | Guatemala | 0.0 /100 | #343 | Tragic 90.7% |
| Immigrants | Central America | 0.0 /100 | #344 | Tragic 90.4% |
| Immigrants | El Salvador | 0.0 /100 | #345 | Tragic 90.3% |