Palestinian vs Korean Median Male Earnings
COMPARE
Palestinian
Korean
Median Male Earnings
Median Male Earnings Comparison
Palestinians
Koreans
$57,778
MEDIAN MALE EARNINGS
96.2/ 100
METRIC RATING
110th/ 347
METRIC RANK
$56,672
MEDIAN MALE EARNINGS
89.4/ 100
METRIC RATING
130th/ 347
METRIC RANK
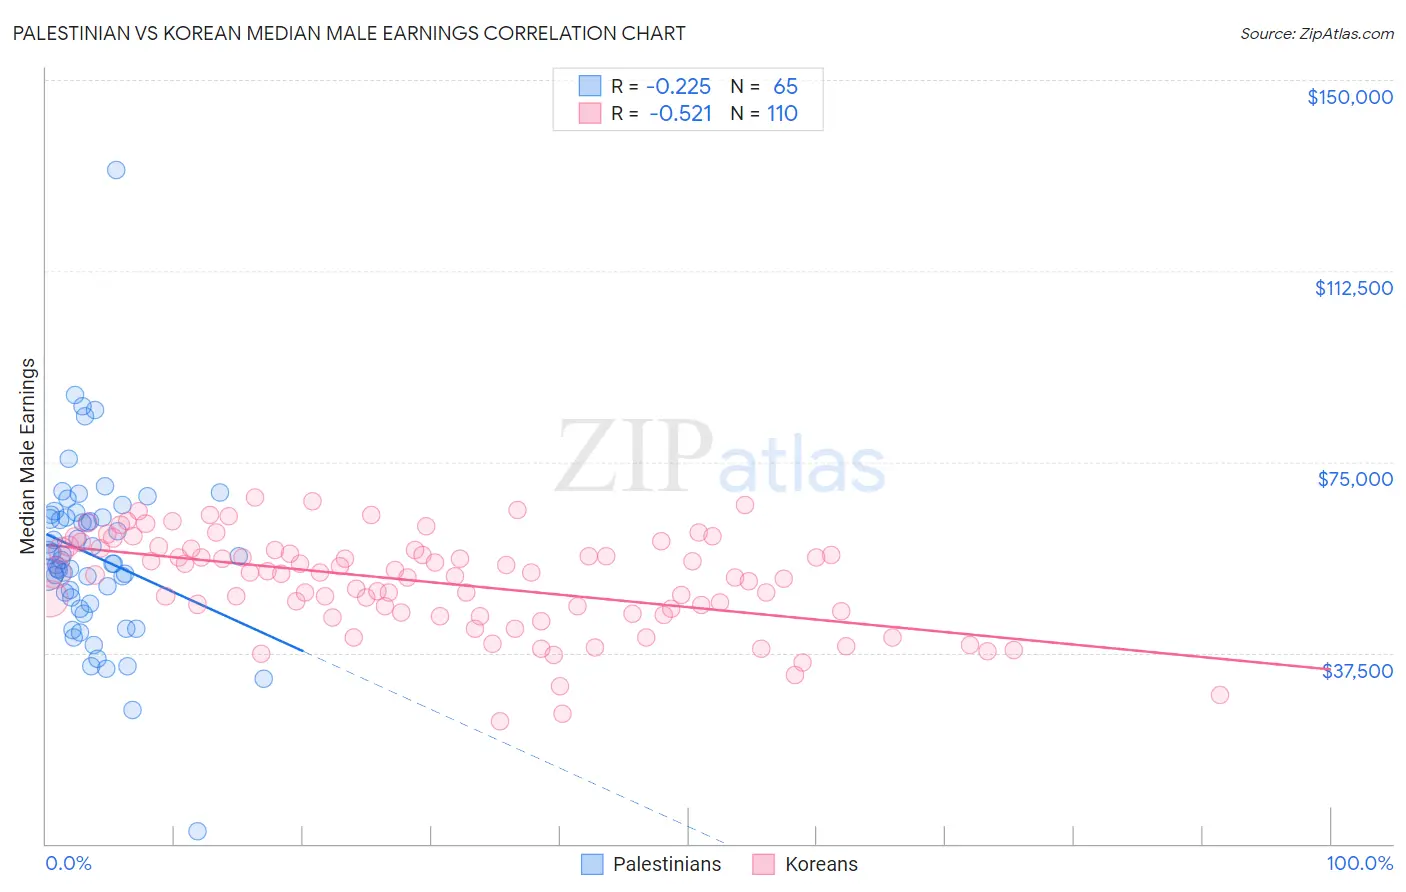
Palestinian vs Korean Median Male Earnings Correlation Chart
The statistical analysis conducted on geographies consisting of 216,446,429 people shows a weak negative correlation between the proportion of Palestinians and median male earnings in the United States with a correlation coefficient (R) of -0.225 and weighted average of $57,778. Similarly, the statistical analysis conducted on geographies consisting of 510,664,628 people shows a substantial negative correlation between the proportion of Koreans and median male earnings in the United States with a correlation coefficient (R) of -0.521 and weighted average of $56,672, a difference of 1.9%.
Median Male Earnings Correlation Summary
| Measurement | Palestinian | Korean |
| Minimum | $2,499 | $24,028 |
| Maximum | $132,344 | $67,994 |
| Range | $129,845 | $43,966 |
| Mean | $56,632 | $51,299 |
| Median | $55,657 | $53,093 |
| Interquartile 25% (IQ1) | $47,716 | $45,357 |
| Interquartile 75% (IQ3) | $64,385 | $57,742 |
| Interquartile Range (IQR) | $16,670 | $12,385 |
| Standard Deviation (Sample) | $17,442 | $9,399 |
| Standard Deviation (Population) | $17,308 | $9,356 |
Demographics Similar to Palestinians and Koreans by Median Male Earnings
In terms of median male earnings, the demographic groups most similar to Palestinians are European ($57,637, a difference of 0.25%), Immigrants from Afghanistan ($57,582, a difference of 0.34%), Carpatho Rusyn ($57,572, a difference of 0.36%), Immigrants from Kuwait ($57,562, a difference of 0.38%), and Swedish ($57,445, a difference of 0.58%). Similarly, the demographic groups most similar to Koreans are Pakistani ($56,719, a difference of 0.080%), Immigrants from Syria ($56,830, a difference of 0.28%), Brazilian ($56,837, a difference of 0.29%), Chinese ($56,872, a difference of 0.35%), and Immigrants from Morocco ($56,958, a difference of 0.50%).
| Demographics | Rating | Rank | Median Male Earnings |
| Palestinians | 96.2 /100 | #110 | Exceptional $57,778 |
| Europeans | 95.6 /100 | #111 | Exceptional $57,637 |
| Immigrants | Afghanistan | 95.4 /100 | #112 | Exceptional $57,582 |
| Carpatho Rusyns | 95.3 /100 | #113 | Exceptional $57,572 |
| Immigrants | Kuwait | 95.3 /100 | #114 | Exceptional $57,562 |
| Swedes | 94.8 /100 | #115 | Exceptional $57,445 |
| Lebanese | 94.6 /100 | #116 | Exceptional $57,409 |
| Immigrants | Zimbabwe | 94.3 /100 | #117 | Exceptional $57,352 |
| Hungarians | 94.0 /100 | #118 | Exceptional $57,309 |
| Arabs | 94.0 /100 | #119 | Exceptional $57,298 |
| Canadians | 93.9 /100 | #120 | Exceptional $57,286 |
| Immigrants | Albania | 93.3 /100 | #121 | Exceptional $57,179 |
| Immigrants | Jordan | 93.1 /100 | #122 | Exceptional $57,145 |
| Slovenes | 93.1 /100 | #123 | Exceptional $57,145 |
| Chileans | 91.9 /100 | #124 | Exceptional $56,973 |
| Immigrants | Morocco | 91.8 /100 | #125 | Exceptional $56,958 |
| Chinese | 91.1 /100 | #126 | Exceptional $56,872 |
| Brazilians | 90.9 /100 | #127 | Exceptional $56,837 |
| Immigrants | Syria | 90.8 /100 | #128 | Exceptional $56,830 |
| Pakistanis | 89.9 /100 | #129 | Excellent $56,719 |
| Koreans | 89.4 /100 | #130 | Excellent $56,672 |