Paiute vs Immigrants from Scotland Per Capita Income
COMPARE
Paiute
Immigrants from Scotland
Per Capita Income
Per Capita Income Comparison
Paiute
Immigrants from Scotland
$37,066
PER CAPITA INCOME
0.1/ 100
METRIC RATING
303rd/ 347
METRIC RANK
$49,893
PER CAPITA INCOME
99.9/ 100
METRIC RATING
60th/ 347
METRIC RANK
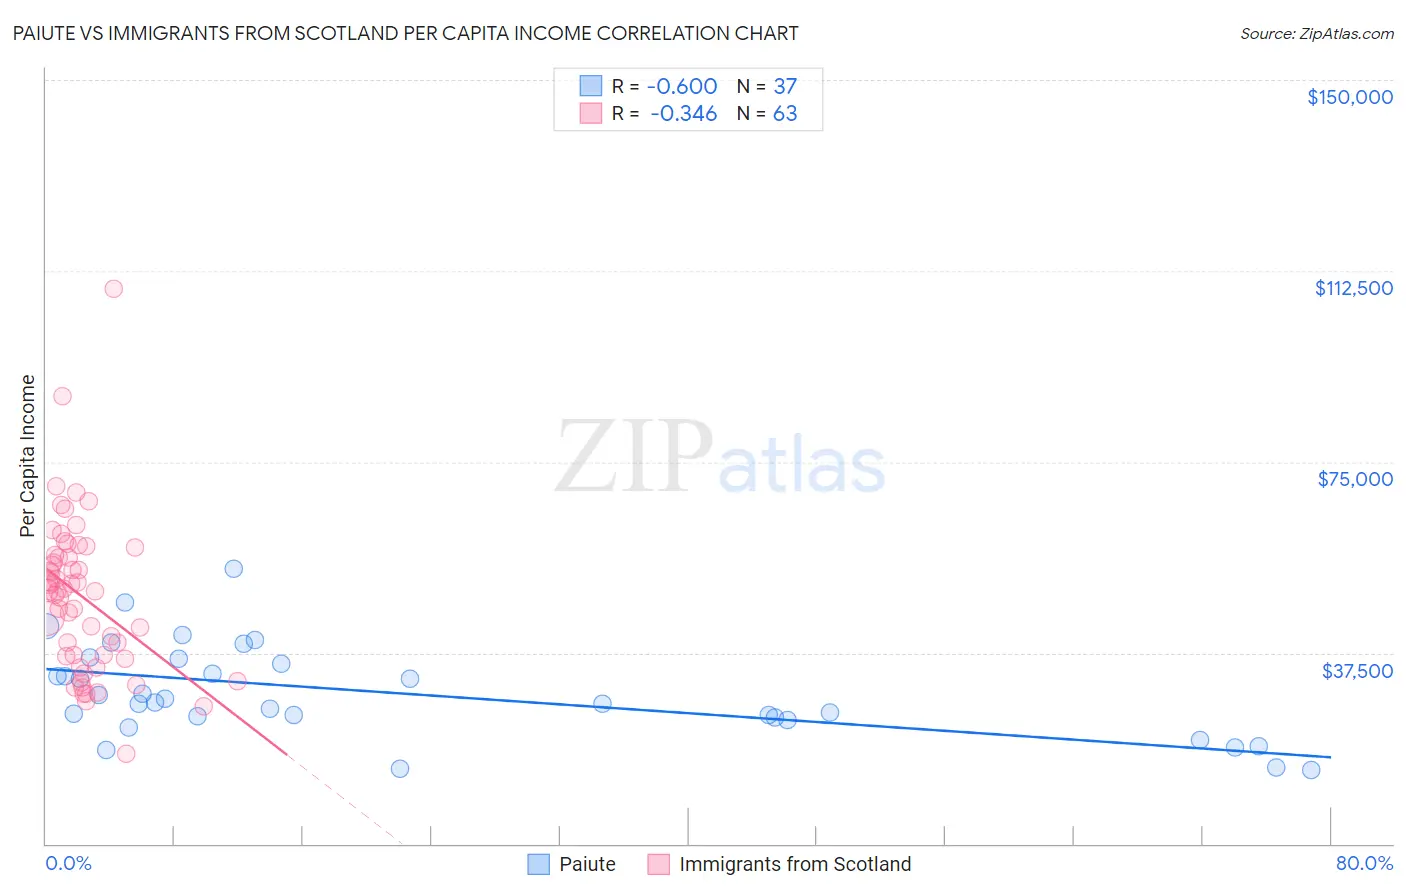
Paiute vs Immigrants from Scotland Per Capita Income Correlation Chart
The statistical analysis conducted on geographies consisting of 58,406,657 people shows a substantial negative correlation between the proportion of Paiute and per capita income in the United States with a correlation coefficient (R) of -0.600 and weighted average of $37,066. Similarly, the statistical analysis conducted on geographies consisting of 196,392,396 people shows a mild negative correlation between the proportion of Immigrants from Scotland and per capita income in the United States with a correlation coefficient (R) of -0.346 and weighted average of $49,893, a difference of 34.6%.
Per Capita Income Correlation Summary
| Measurement | Paiute | Immigrants from Scotland |
| Minimum | $14,446 | $17,665 |
| Maximum | $53,939 | $108,962 |
| Range | $39,493 | $91,297 |
| Mean | $29,535 | $48,673 |
| Median | $27,776 | $49,771 |
| Interquartile 25% (IQ1) | $24,580 | $36,731 |
| Interquartile 75% (IQ3) | $35,820 | $56,663 |
| Interquartile Range (IQR) | $11,240 | $19,932 |
| Standard Deviation (Sample) | $9,120 | $15,263 |
| Standard Deviation (Population) | $8,996 | $15,141 |
Similar Demographics by Per Capita Income
Demographics Similar to Paiute by Per Capita Income
In terms of per capita income, the demographic groups most similar to Paiute are Shoshone ($37,072, a difference of 0.020%), Honduran ($37,031, a difference of 0.090%), Ottawa ($37,101, a difference of 0.10%), Inupiat ($36,999, a difference of 0.18%), and Immigrants from Bahamas ($37,193, a difference of 0.34%).
| Demographics | Rating | Rank | Per Capita Income |
| Indonesians | 0.1 /100 | #296 | Tragic $37,300 |
| Haitians | 0.1 /100 | #297 | Tragic $37,289 |
| Immigrants | Caribbean | 0.1 /100 | #298 | Tragic $37,254 |
| Cherokee | 0.1 /100 | #299 | Tragic $37,203 |
| Immigrants | Bahamas | 0.1 /100 | #300 | Tragic $37,193 |
| Ottawa | 0.1 /100 | #301 | Tragic $37,101 |
| Shoshone | 0.1 /100 | #302 | Tragic $37,072 |
| Paiute | 0.1 /100 | #303 | Tragic $37,066 |
| Hondurans | 0.1 /100 | #304 | Tragic $37,031 |
| Inupiat | 0.1 /100 | #305 | Tragic $36,999 |
| Immigrants | Haiti | 0.0 /100 | #306 | Tragic $36,849 |
| Immigrants | Latin America | 0.0 /100 | #307 | Tragic $36,823 |
| Fijians | 0.0 /100 | #308 | Tragic $36,690 |
| Immigrants | Honduras | 0.0 /100 | #309 | Tragic $36,665 |
| Ute | 0.0 /100 | #310 | Tragic $36,651 |
Demographics Similar to Immigrants from Scotland by Per Capita Income
In terms of per capita income, the demographic groups most similar to Immigrants from Scotland are Bhutanese ($49,894, a difference of 0.0%), Argentinean ($49,862, a difference of 0.060%), Immigrants from Malaysia ($49,983, a difference of 0.18%), South African ($50,044, a difference of 0.30%), and Immigrants from Asia ($49,741, a difference of 0.31%).
| Demographics | Rating | Rank | Per Capita Income |
| Paraguayans | 99.9 /100 | #53 | Exceptional $50,385 |
| Immigrants | Belarus | 99.9 /100 | #54 | Exceptional $50,303 |
| Immigrants | Western Europe | 99.9 /100 | #55 | Exceptional $50,065 |
| Asians | 99.9 /100 | #56 | Exceptional $50,057 |
| South Africans | 99.9 /100 | #57 | Exceptional $50,044 |
| Immigrants | Malaysia | 99.9 /100 | #58 | Exceptional $49,983 |
| Bhutanese | 99.9 /100 | #59 | Exceptional $49,894 |
| Immigrants | Scotland | 99.9 /100 | #60 | Exceptional $49,893 |
| Argentineans | 99.9 /100 | #61 | Exceptional $49,862 |
| Immigrants | Asia | 99.9 /100 | #62 | Exceptional $49,741 |
| Maltese | 99.9 /100 | #63 | Exceptional $49,640 |
| Immigrants | Argentina | 99.9 /100 | #64 | Exceptional $49,627 |
| Bolivians | 99.9 /100 | #65 | Exceptional $49,526 |
| Immigrants | Bulgaria | 99.9 /100 | #66 | Exceptional $49,482 |
| Immigrants | Romania | 99.9 /100 | #67 | Exceptional $49,463 |