Immigrants from Switzerland vs Slovak Wage/Income Gap
COMPARE
Immigrants from Switzerland
Slovak
Wage/Income Gap
Wage/Income Gap Comparison
Immigrants from Switzerland
Slovaks
27.7%
WAGE/INCOME GAP
1.0/ 100
METRIC RATING
264th/ 347
METRIC RANK
28.9%
WAGE/INCOME GAP
0.1/ 100
METRIC RATING
319th/ 347
METRIC RANK
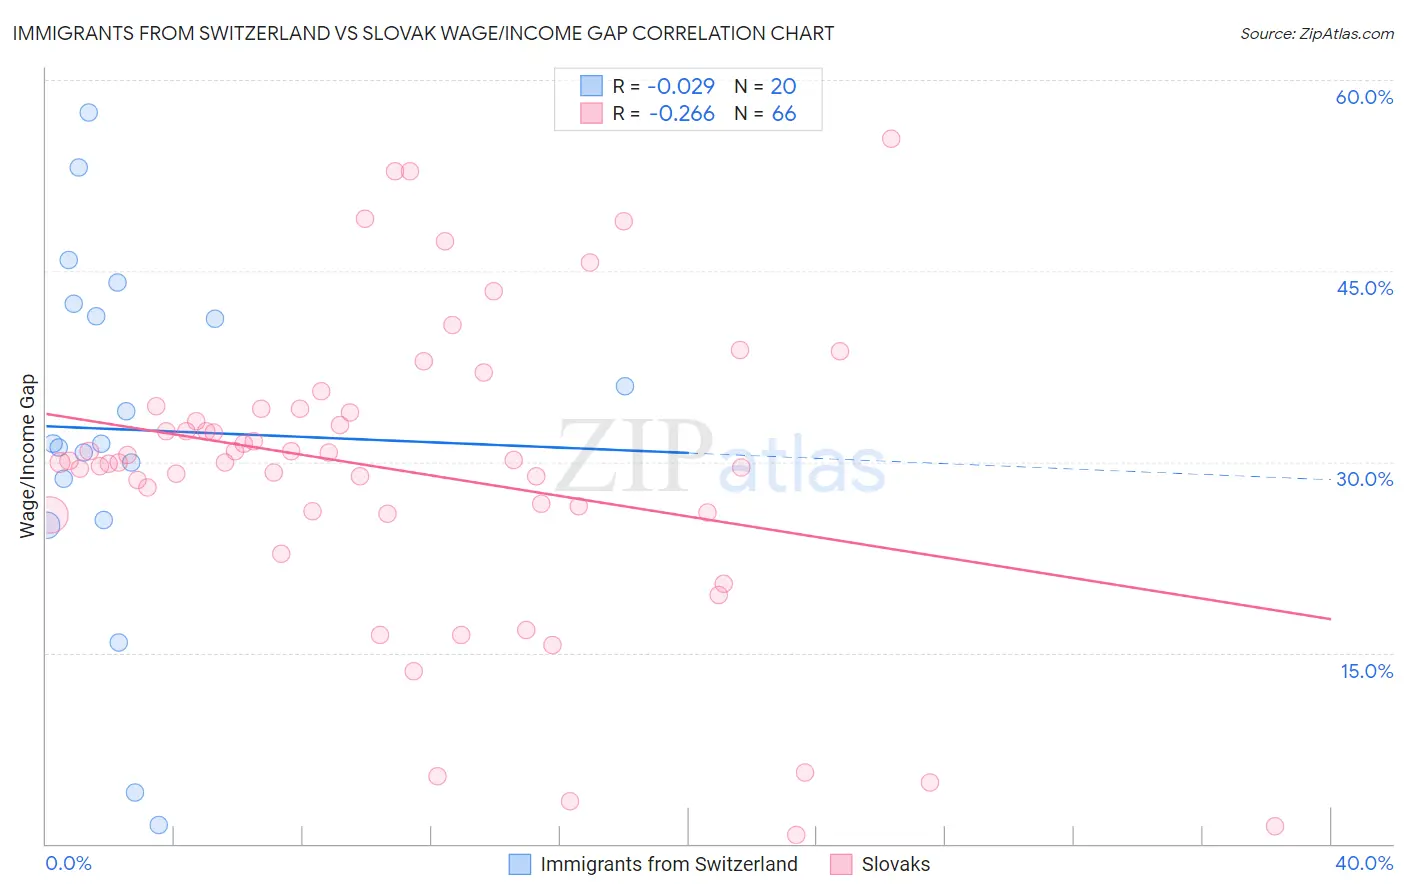
Immigrants from Switzerland vs Slovak Wage/Income Gap Correlation Chart
The statistical analysis conducted on geographies consisting of 148,012,868 people shows no correlation between the proportion of Immigrants from Switzerland and wage/income gap percentage in the United States with a correlation coefficient (R) of -0.029 and weighted average of 27.7%. Similarly, the statistical analysis conducted on geographies consisting of 397,444,585 people shows a weak negative correlation between the proportion of Slovaks and wage/income gap percentage in the United States with a correlation coefficient (R) of -0.266 and weighted average of 28.9%, a difference of 4.3%.
Wage/Income Gap Correlation Summary
| Measurement | Immigrants from Switzerland | Slovak |
| Minimum | 1.5% | 0.72% |
| Maximum | 57.5% | 55.3% |
| Range | 56.0% | 54.6% |
| Mean | 32.5% | 29.3% |
| Median | 31.4% | 30.0% |
| Interquartile 25% (IQ1) | 27.1% | 26.0% |
| Interquartile 75% (IQ3) | 42.0% | 34.2% |
| Interquartile Range (IQR) | 14.9% | 8.2% |
| Standard Deviation (Sample) | 14.2% | 11.9% |
| Standard Deviation (Population) | 13.8% | 11.8% |
Similar Demographics by Wage/Income Gap
Demographics Similar to Immigrants from Switzerland by Wage/Income Gap
In terms of wage/income gap, the demographic groups most similar to Immigrants from Switzerland are Serbian (27.7%, a difference of 0.0%), Hmong (27.7%, a difference of 0.010%), Turkish (27.7%, a difference of 0.020%), New Zealander (27.7%, a difference of 0.10%), and Potawatomi (27.7%, a difference of 0.12%).
| Demographics | Rating | Rank | Wage/Income Gap |
| Luxembourgers | 1.9 /100 | #257 | Tragic 27.4% |
| Slavs | 1.8 /100 | #258 | Tragic 27.4% |
| Icelanders | 1.8 /100 | #259 | Tragic 27.5% |
| Tongans | 1.7 /100 | #260 | Tragic 27.5% |
| Immigrants | Germany | 1.5 /100 | #261 | Tragic 27.5% |
| Immigrants | Lebanon | 1.5 /100 | #262 | Tragic 27.5% |
| Syrians | 1.4 /100 | #263 | Tragic 27.6% |
| Immigrants | Switzerland | 1.0 /100 | #264 | Tragic 27.7% |
| Serbians | 1.0 /100 | #265 | Tragic 27.7% |
| Hmong | 1.0 /100 | #266 | Tragic 27.7% |
| Turks | 1.0 /100 | #267 | Tragic 27.7% |
| New Zealanders | 1.0 /100 | #268 | Tragic 27.7% |
| Potawatomi | 0.9 /100 | #269 | Tragic 27.7% |
| Immigrants | Western Europe | 0.9 /100 | #270 | Tragic 27.8% |
| Ute | 0.8 /100 | #271 | Tragic 27.8% |
Demographics Similar to Slovaks by Wage/Income Gap
In terms of wage/income gap, the demographic groups most similar to Slovaks are British (28.9%, a difference of 0.060%), Welsh (28.9%, a difference of 0.13%), Immigrants from Singapore (28.9%, a difference of 0.15%), Norwegian (29.0%, a difference of 0.25%), and Basque (28.8%, a difference of 0.31%).
| Demographics | Rating | Rank | Wage/Income Gap |
| Eastern Europeans | 0.1 /100 | #312 | Tragic 28.6% |
| French | 0.1 /100 | #313 | Tragic 28.7% |
| Immigrants | Scotland | 0.1 /100 | #314 | Tragic 28.7% |
| Maltese | 0.1 /100 | #315 | Tragic 28.7% |
| Lithuanians | 0.1 /100 | #316 | Tragic 28.7% |
| Belgians | 0.1 /100 | #317 | Tragic 28.8% |
| Basques | 0.1 /100 | #318 | Tragic 28.8% |
| Slovaks | 0.1 /100 | #319 | Tragic 28.9% |
| British | 0.1 /100 | #320 | Tragic 28.9% |
| Welsh | 0.1 /100 | #321 | Tragic 28.9% |
| Immigrants | Singapore | 0.1 /100 | #322 | Tragic 28.9% |
| Norwegians | 0.1 /100 | #323 | Tragic 29.0% |
| Croatians | 0.0 /100 | #324 | Tragic 29.0% |
| Hungarians | 0.0 /100 | #325 | Tragic 29.0% |
| Immigrants | Belgium | 0.0 /100 | #326 | Tragic 29.0% |