Egyptian vs Houma Median Earnings
COMPARE
Egyptian
Houma
Median Earnings
Median Earnings Comparison
Egyptians
Houma
$51,701
MEDIAN EARNINGS
99.9/ 100
METRIC RATING
55th/ 347
METRIC RANK
$38,949
MEDIAN EARNINGS
0.0/ 100
METRIC RATING
333rd/ 347
METRIC RANK
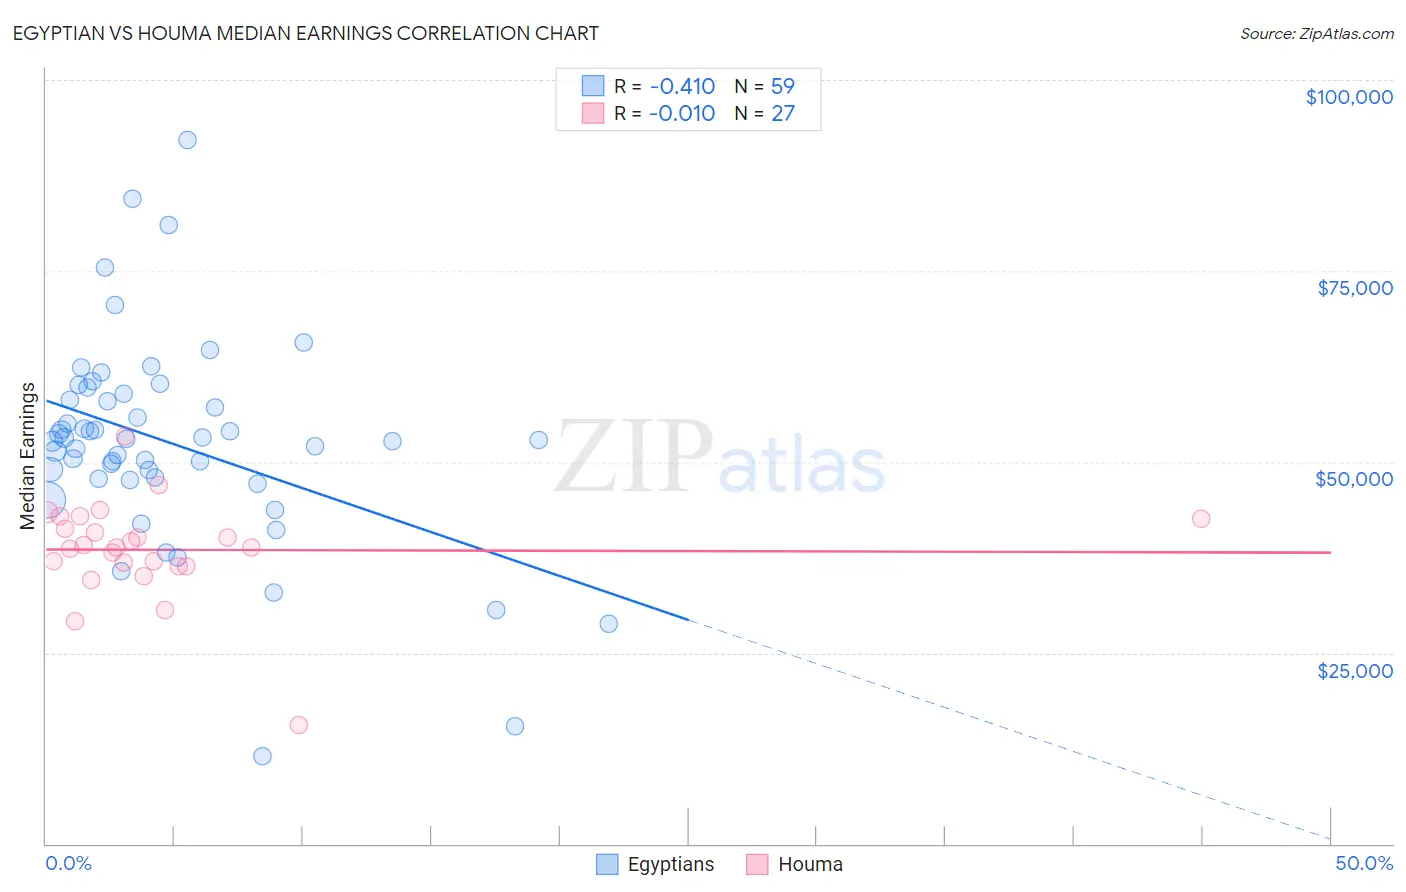
Egyptian vs Houma Median Earnings Correlation Chart
The statistical analysis conducted on geographies consisting of 276,931,355 people shows a moderate negative correlation between the proportion of Egyptians and median earnings in the United States with a correlation coefficient (R) of -0.410 and weighted average of $51,701. Similarly, the statistical analysis conducted on geographies consisting of 36,796,366 people shows no correlation between the proportion of Houma and median earnings in the United States with a correlation coefficient (R) of -0.010 and weighted average of $38,949, a difference of 32.7%.
Median Earnings Correlation Summary
| Measurement | Egyptian | Houma |
| Minimum | $11,442 | $15,495 |
| Maximum | $92,200 | $53,358 |
| Range | $80,758 | $37,863 |
| Mean | $52,434 | $38,485 |
| Median | $52,906 | $38,771 |
| Interquartile 25% (IQ1) | $47,712 | $36,392 |
| Interquartile 75% (IQ3) | $58,933 | $42,500 |
| Interquartile Range (IQR) | $11,221 | $6,108 |
| Standard Deviation (Sample) | $13,766 | $6,619 |
| Standard Deviation (Population) | $13,649 | $6,495 |
Similar Demographics by Median Earnings
Demographics Similar to Egyptians by Median Earnings
In terms of median earnings, the demographic groups most similar to Egyptians are Immigrants from Pakistan ($51,693, a difference of 0.010%), Immigrants from Indonesia ($51,715, a difference of 0.030%), Immigrants from Norway ($51,758, a difference of 0.11%), Estonian ($51,772, a difference of 0.14%), and Immigrants from Eastern Europe ($51,624, a difference of 0.15%).
| Demographics | Rating | Rank | Median Earnings |
| Immigrants | Europe | 100.0 /100 | #48 | Exceptional $52,195 |
| Bolivians | 100.0 /100 | #49 | Exceptional $52,005 |
| Immigrants | South Africa | 100.0 /100 | #50 | Exceptional $51,850 |
| Immigrants | Austria | 99.9 /100 | #51 | Exceptional $51,826 |
| Estonians | 99.9 /100 | #52 | Exceptional $51,772 |
| Immigrants | Norway | 99.9 /100 | #53 | Exceptional $51,758 |
| Immigrants | Indonesia | 99.9 /100 | #54 | Exceptional $51,715 |
| Egyptians | 99.9 /100 | #55 | Exceptional $51,701 |
| Immigrants | Pakistan | 99.9 /100 | #56 | Exceptional $51,693 |
| Immigrants | Eastern Europe | 99.9 /100 | #57 | Exceptional $51,624 |
| Immigrants | Bolivia | 99.9 /100 | #58 | Exceptional $51,605 |
| Immigrants | Croatia | 99.9 /100 | #59 | Exceptional $51,581 |
| Immigrants | Serbia | 99.9 /100 | #60 | Exceptional $51,557 |
| Immigrants | Latvia | 99.9 /100 | #61 | Exceptional $51,555 |
| Immigrants | Romania | 99.9 /100 | #62 | Exceptional $51,337 |
Demographics Similar to Houma by Median Earnings
In terms of median earnings, the demographic groups most similar to Houma are Spanish American Indian ($38,907, a difference of 0.11%), Native/Alaskan ($38,896, a difference of 0.14%), Yakama ($39,107, a difference of 0.41%), Immigrants from Mexico ($39,114, a difference of 0.42%), and Immigrants from Congo ($39,169, a difference of 0.57%).
| Demographics | Rating | Rank | Median Earnings |
| Immigrants | Yemen | 0.0 /100 | #326 | Tragic $39,540 |
| Yuman | 0.0 /100 | #327 | Tragic $39,523 |
| Sioux | 0.0 /100 | #328 | Tragic $39,448 |
| Kiowa | 0.0 /100 | #329 | Tragic $39,232 |
| Immigrants | Congo | 0.0 /100 | #330 | Tragic $39,169 |
| Immigrants | Mexico | 0.0 /100 | #331 | Tragic $39,114 |
| Yakama | 0.0 /100 | #332 | Tragic $39,107 |
| Houma | 0.0 /100 | #333 | Tragic $38,949 |
| Spanish American Indians | 0.0 /100 | #334 | Tragic $38,907 |
| Natives/Alaskans | 0.0 /100 | #335 | Tragic $38,896 |
| Crow | 0.0 /100 | #336 | Tragic $38,707 |
| Immigrants | Cuba | 0.0 /100 | #337 | Tragic $38,426 |
| Pima | 0.0 /100 | #338 | Tragic $38,285 |
| Menominee | 0.0 /100 | #339 | Tragic $37,884 |
| Navajo | 0.0 /100 | #340 | Tragic $36,999 |